Need to animate data based on numeric values or time intervals? The Slider template in ArcGIS Instant Apps is a perfect way to do this. It’s ideal for displaying historical, live, or even future data. Users can interact with the slider to see how the data evolves, offering a dynamic and engaging way to explore information and also help spot trends and patterns.
Time-Enabled Slider
Looking at data over time is a great way to uncover trends, identify patterns, and make informed decisions based on historical insights. I used it to set up my Bee-yond Borders Instant App which can be found in our Map Gallery.
The first step was to ensure the map layer included a time element and that time settings are configured.
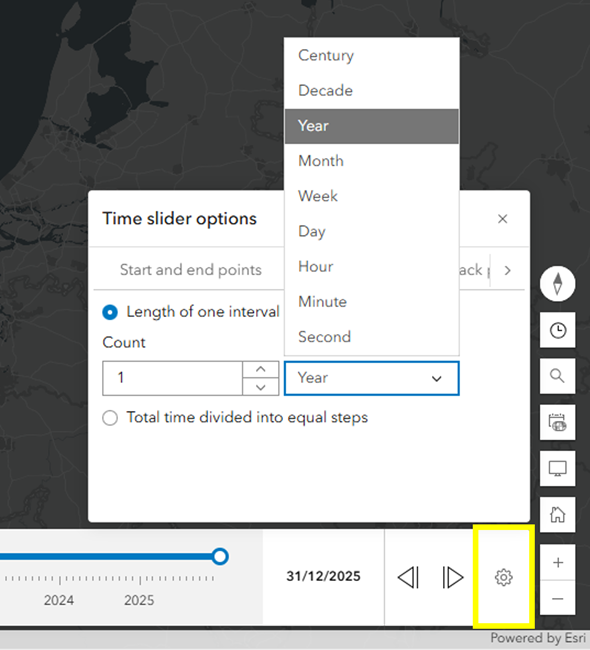
While in Map Viewer, I set up the Time slider – these settings were then used by the Instant App. Don’t worry about getting it right the first time, you can always pop back into Map Viewer if you need to change something (then just remember to refresh your Instant App!).
I set the time slider to yearly intervals to visualise data from the BeeWalk survey, conducted by the Bumblebee Conservation Trust and volunteers between 2009-2024.
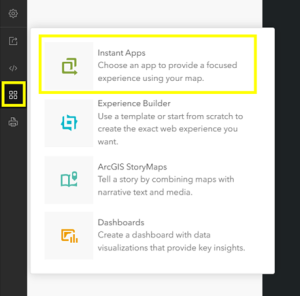
Then, I brought it into the Slider template in Instant Apps to explore further.
The first thing I did was toggle off Express mode to see all the configuration settings available to me. If you have a time enabled layer it will automatically create a Time slider – we will have a look at the other option, a Numeric slider, later on in this blog.
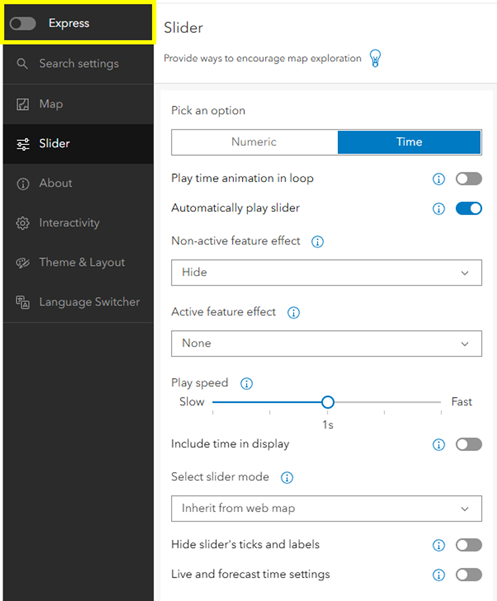
I enabled automatic play, so the slider starts rolling through the years as soon as the app opens.
There are various effect options for Active and Non-active features – test them out to see what works best with your data! I decided to leave it as the default: hide the Non-active features and have no effect on the Active features as this clashed with the symbology I’d set up.
Want to whizz (or should I say buzz…) through time? Have a play with the speed settings!
Another great feature is the ability to include live and forecast data. This allows the app to show data for a specific period, including recent updates. Check how often your data layer is updated and use that to set the Interval length and Interval unit. Enable Snap to map time to avoid overlapping features.
This setup is especially useful for visualising real-time data or forecasting future events – like weather patterns or traffic conditions.
Numeric Values Slider
The Numeric slider can animate any integer field in one or more layers. To explore this, I created a slider to examine the magnitude of earthquakes using a layer from the British Geological Survey available in the ArcGIS Living Atlas.
I went through the available settings, trying different options to see what best suited the data and the story I wanted to tell. Here are some key steps I followed:
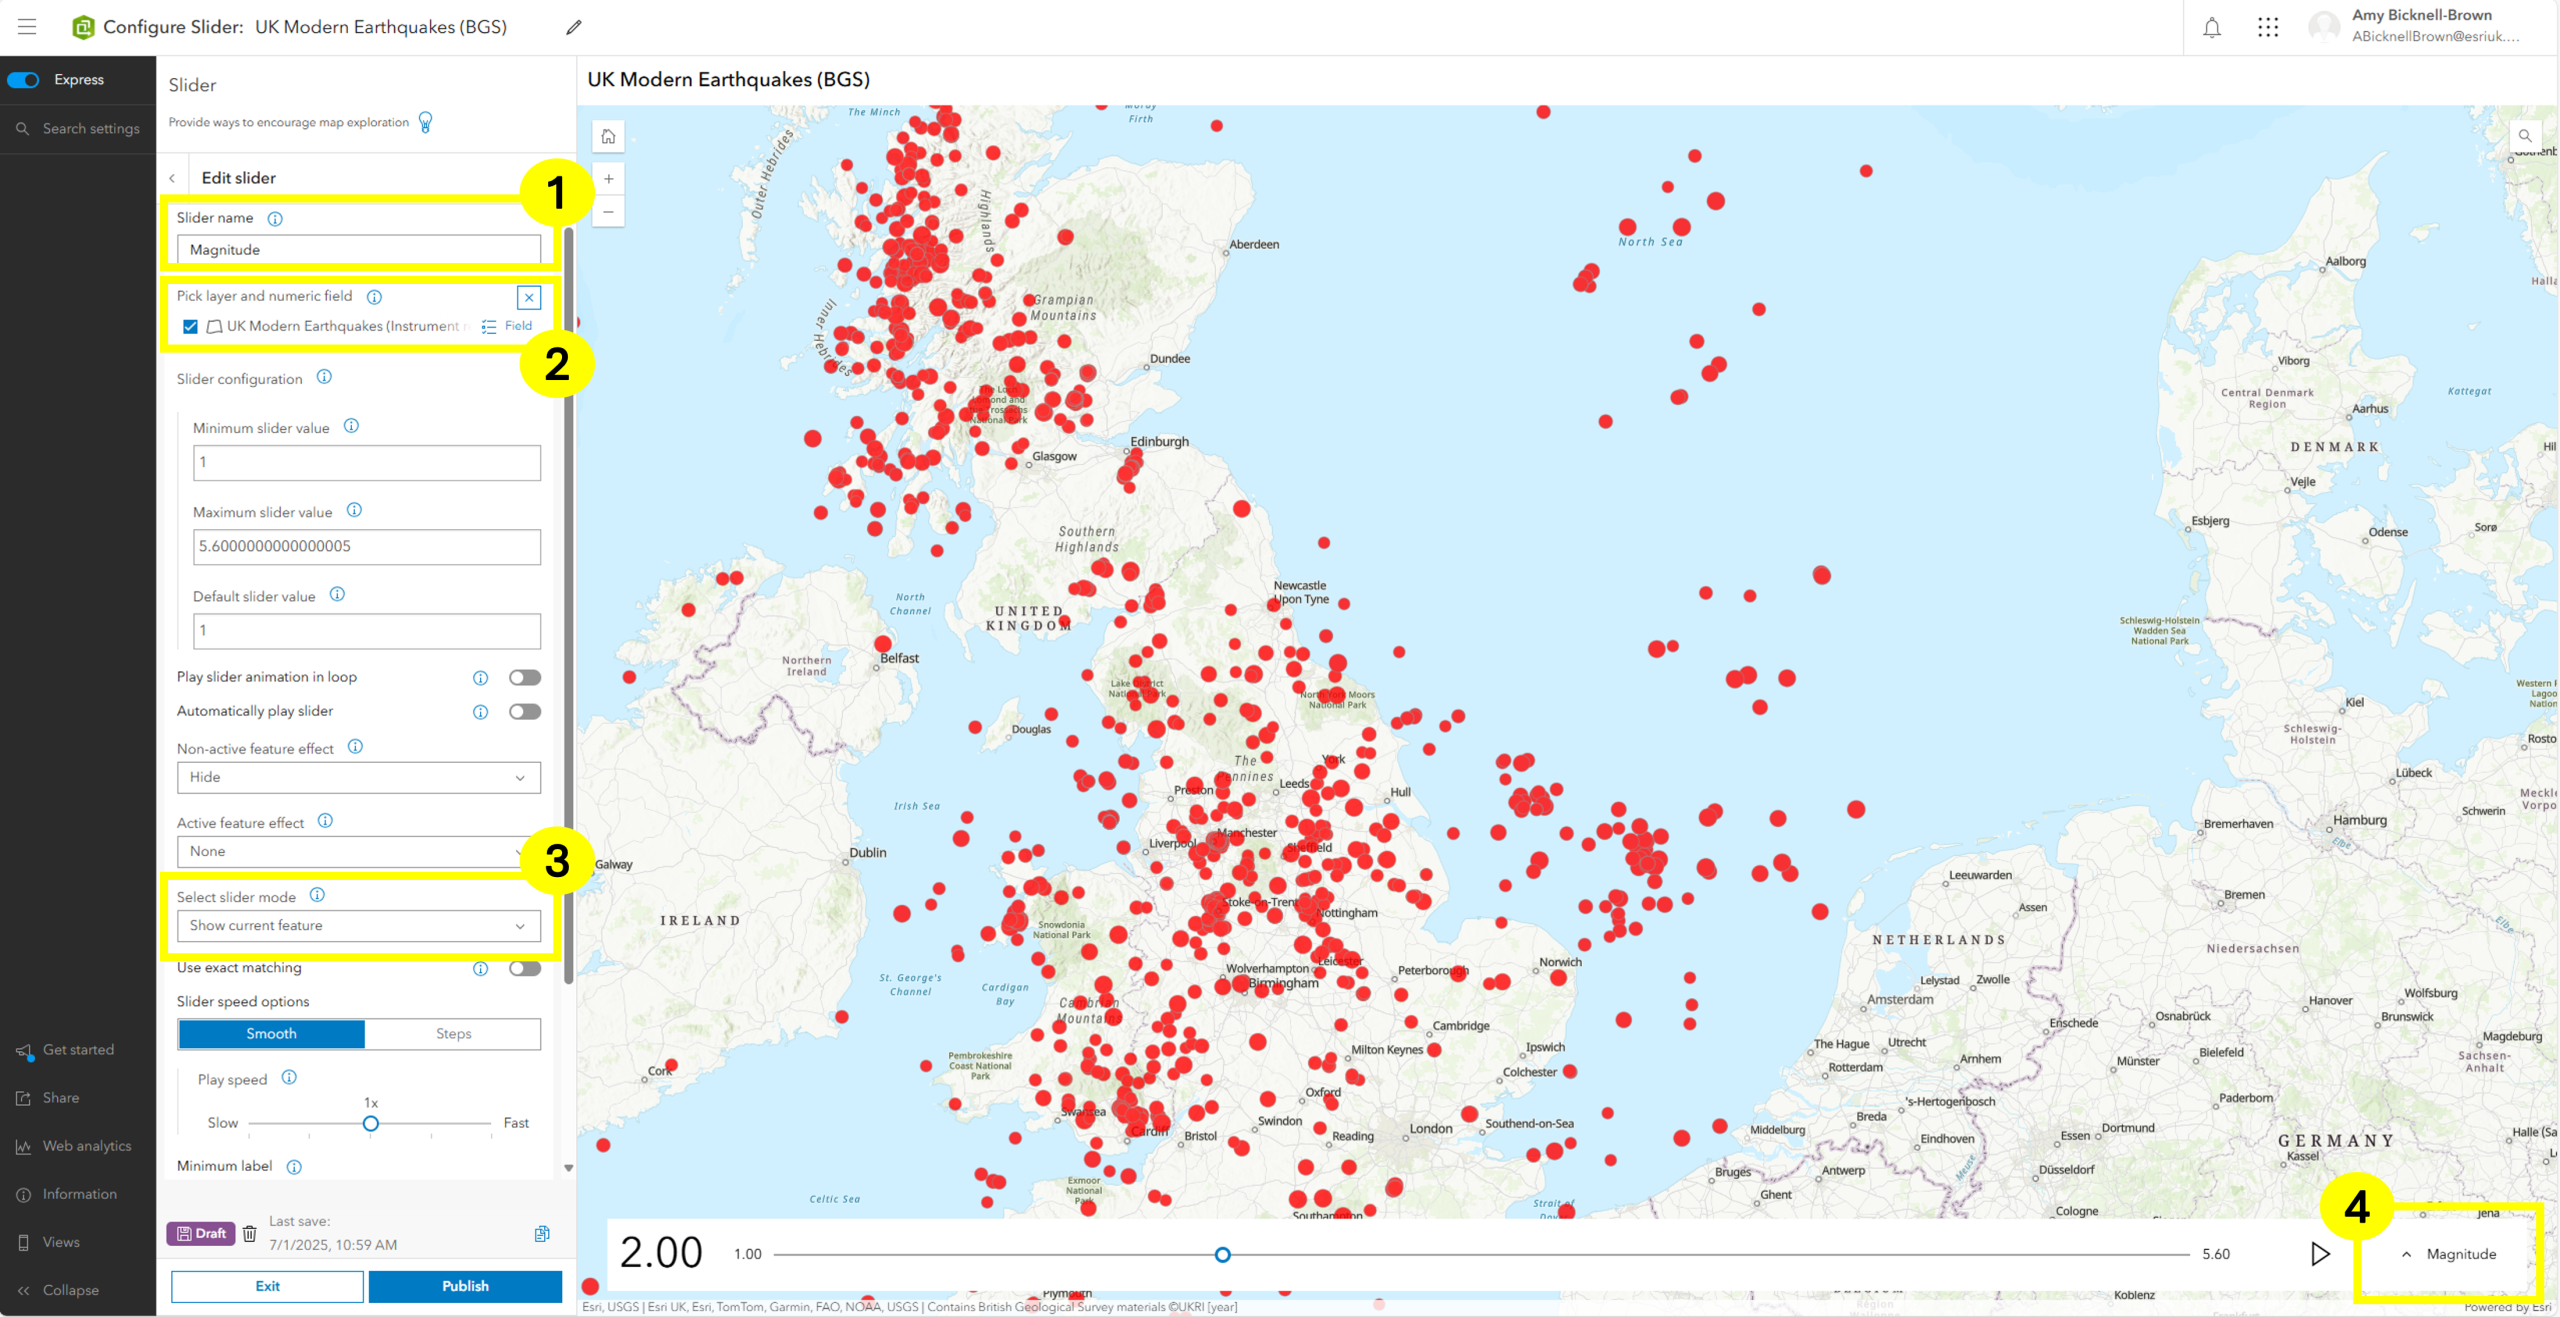
- Gave the slider a meaningful name - this helped both me and the audience understand what the slider represented (especially important when using multiple sliders).
- Selected the layer and field the slider would use.
- Chose how the data displays as the slider progresses – testing different options helped me find the most effective one.
- Multiple sliders – this section allowed me to switch between them easily.
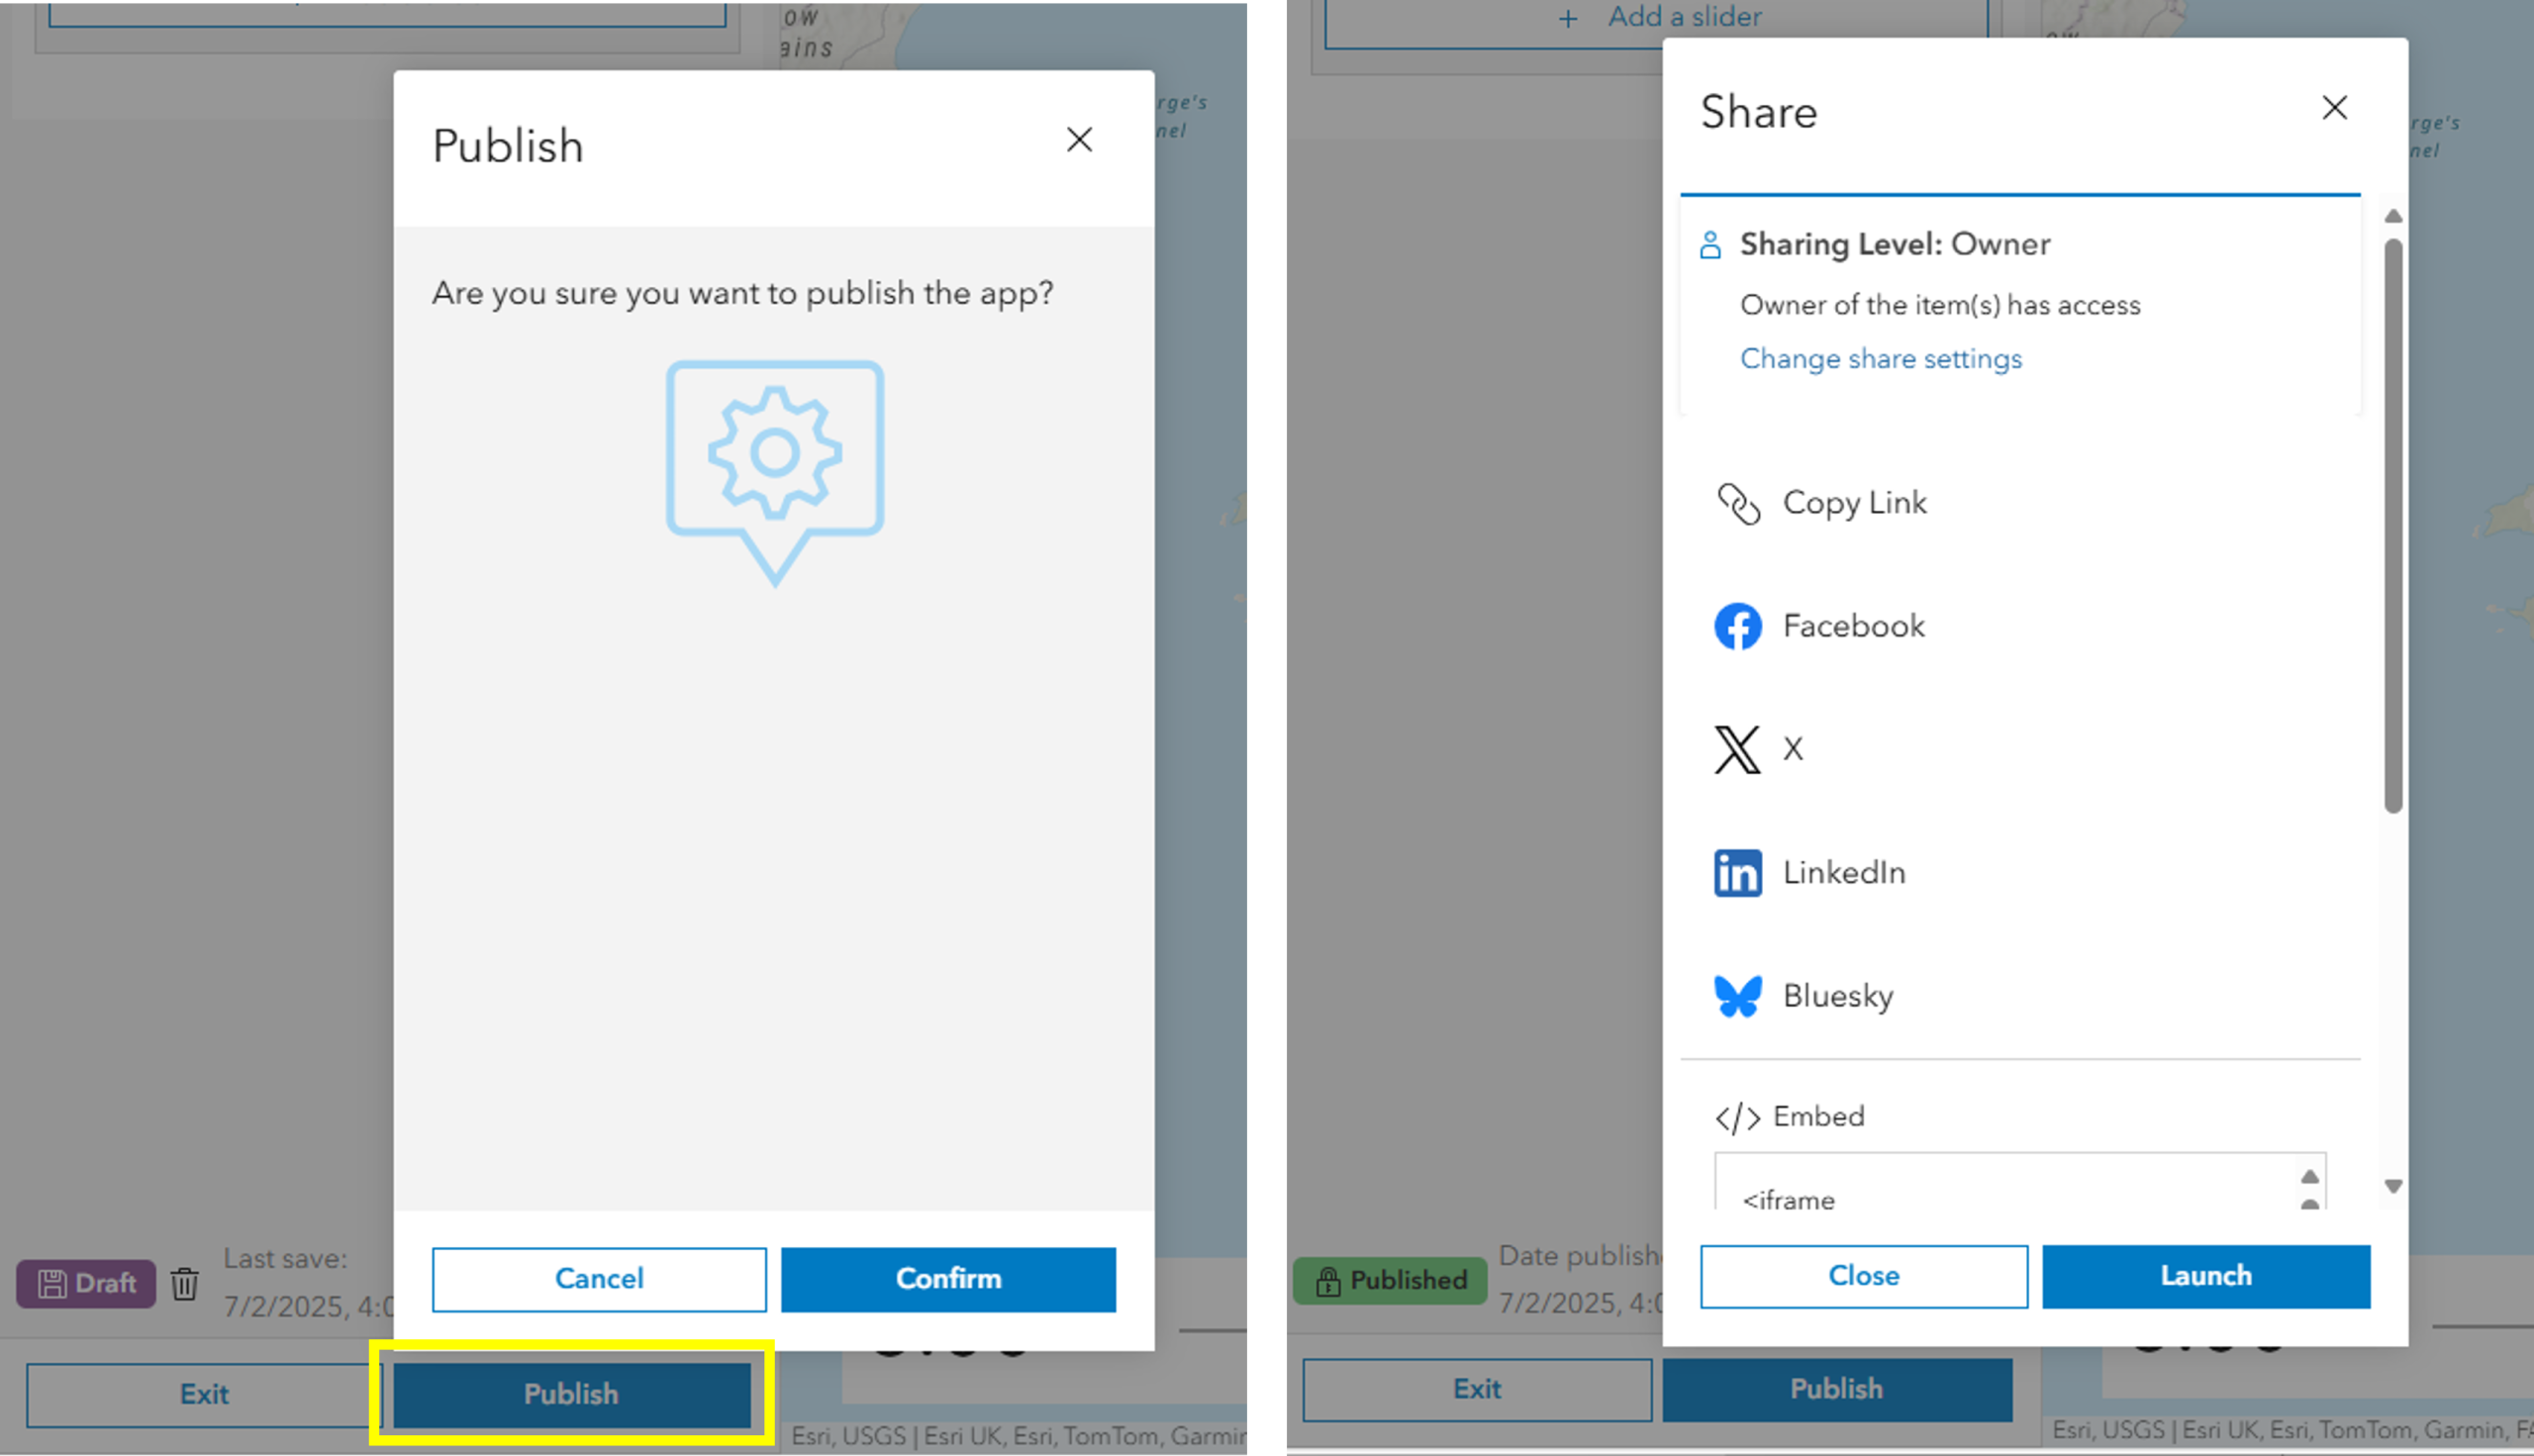
Once I was happy with the app, the final step was to publish and share it!