Blog Archives

Tech Giants Anticipate Augmented Reality Future
A recent Apple acquisition signals more business investment in augmented reality. Which businesses are already benefiting from AR?
Apple’s acquisition of Akonia Holographics, maker of lenses for augmented reality (AR) glasses, could signal the next wave in mobile computing for businesses and consumers—devices that are more wearable and less intrusive.
AR glasses superimpose location-specific information and graphics onto a user’s field of vision through transparent lenses. In 2012, Google launched the first notable iteration of AR glasses, then called Google Glass. In 2015, parent company, Alphabet ended production of Glass temporarily. Since then, makers of smartphones and mobile devices have been working to incorporate AR applications into their products.
Wearing the Future
Apple’s CEO Tim Cook has called augmented reality a “big and profound” technology development. Among tech giants, he’s not alone in this assessment. Microsoft’s HoloLens stands out as one of the more mature AR headset technologies. Other headset makers have focused on virtual reality goggles, which encapsulate the user in a digitally generated world.

While AR has been available on smartphones and handheld devices (think Pokémon Go) for some time, the growth of wearable devices may hold significant promise for businesses. Consider that Alphabet’s Glass headset, while a dud in the consumer world, showed strong enough adoption by business users that Alphabet relaunched the effort in 2017. Google Glass is now being used by employees at the edge of organizations—GE field workers and doctors at Dignity Health among them.
Doctors could be among those who benefit from Apple’s Akonia acquisition. Apple runs its own health division, which partners with software providers to deliver medical applications on iPads and related devices. Through the Akonia acquisition, that and other Apple divisions could add cutting-edge AR technology to their portfolios.
Locating the Field of Vision
For any company looking to incorporate augmented reality into employee workflows, experts see location as critically important. One Toms River, New Jersey, utility offers a case in point with its service-focused application of AR, which saves time and resources while increasing accuracy.
Field workers at Toms River Municipal Utilities Authority use augmented reality and HoloLens to see underground utility lines beneath their feet as AR-generated holograms projected at their exact locations. The system relies on a geographic information system (GIS) that tracks the location of every pipeline, valve, connection, and intersection, to an accuracy of just centimetres.
With the location intelligence powered by that data, work crews minimize the risk of digging through critical infrastructure, Len Bundra, the organization’s IT director, told WhereNext last year. “You want to make sure your GIS is in shape and accurate,” Bundra explained. “If your maps are inaccurate, don’t think the [AR] hologram is going to make them accurate.”

As innovative organizations know well, location is critical in AR apps. Placing digital objects in physical space requires a deep understanding of where assets are located.
AR in Practice across Industries
Many organizations, including the planning agency for the US capital, start forays into augmented reality by creating a 3D digital twin—a precise model of reality made with GIS. The digital twin includes detailed attributes about assets. This information makes it easier to create AR experiences that guide real-world interactions.
Examples of industries embracing 3D GIS with an eye toward AR:
- Architecture, engineering, and construction firms combine 3D GIS data with building information models to inform infrastructure design and construction.
- Urban planners use 3D GIS to convey zoning information and visualize plans in a real-world context.
- Utilities view and analyze more-accurate representations of real-world assets–for instance, revealing the location and details of underground infrastructure using AR without needing to dig.
- Defense and intelligence operators use 3D GIS to provide a common operating picture and enhanced context to aid rapid decision-making
With AR hardware manufacturers adding devices, companies such as Apple making acquisitions, and early adopters like the New Jersey utility realizing compelling returns, many industry observers expect augmented reality to become a valuable tool throughout the business world.
One market researcher pegs AR’s annual growth rate at nearly 74 percent through 2023. Meanwhile, leading companies are already demonstrating that a combination of location intelligence and digital guidance can deliver real-world productivity gains.

Think Tank: Defining the Business Case for Drones
The companies using drones to their greatest potential understand the strategic value of location intelligence, experts say.
Drones have flown into public discourse powered by quad motors and hobbyist appeal. They hover over landmarks, snapping pictures for photography enthusiasts. They form airborne networks to create modern-day fireworks displays.
But what are drones doing for business? How will that evolve in the next several years? And, how have drones improved with the help of big data, IoT, and artificial intelligence?
WhereNext assembled several thought leaders to explore these questions. In this latest instalment of the Think Tank series, Esri Professional Services VP Brian Cross leads a discussion with Don Carson, an expert on location intelligence for the utilities industry, and Mansour Raad, a specialist in big data, artificial intelligence, and location intelligence across industries.
Defining Business Value
Brian Cross: I want to cut through the fluff about drones in business, and find out what you’re seeing in reality and on the cutting edge. Don, in your experience, where are executives seeing real business value in unmanned aircraft and remote-sensing capabilities?
Don Carson: There are really two key areas of business value today. One is gaining efficiencies and reducing operating costs, and the second is employee safety. Drones can take video or photographs to assess conditions and help companies pinpoint where services or equipment might be at risk.
A recent report [by Skyward, a Verizon subsidiary and maker of drone software] showed that while only 1 in 10 companies use drones today, 88 percent of those that do have achieved a positive return on investment within a year.
Competitive Advantage and IoT
Industry leaders are outpacing competitors by combining IoT data with machine learning, predictive and prescriptive analytics, and location intelligence. Learn how in this eBook.
The companies we work with are taking advantage of drones to get into the field faster, cheaper, and with greater safety.
Mansour Raad: Another way to look at it is that drones extend the human senses. Today, companies are using drones to help employees see situations from new vantage points. Tomorrow, drones will extend our other senses, including hearing for noise detection around airports, perhaps; and smell for detecting gas leaks, for example.
The Drone Playbook
Cross: What are some of the workflows and business problems drones are addressing now?
Carson: One example is inspections for utilities—of poles, wireless towers, wind turbines, and other infrastructure. Traditionally, those have required a great deal of time to perform, and come with a high risk to employee safety. In fact, tower climbing is recognized as among the most dangerous jobs. And a single tower climb can cost between $2,000 and $5,000. Drones make that work faster, cheaper, and safer.
Cross: But there’s more to using a drone for business purposes than a hobbyist might realize.
Carson: That’s true. Companies that see the best return on this technology have what we call a high location IQ. They understand that you don’t just launch a drone and hope to find something that benefits your operations. They identify a business challenge, define the flight paths that will help them assess the challenge, and then use location intelligence to analyse the data and identify actions they should take.

Since drones can fly quite low and deliver high-resolution output, some agricultural companies are using them to detect crop health—down to individual plants and individual leaves.
Don Carson, Esri
Extending the Human CPU
Cross: Mansour, how are companies making sense of the big data collected by drones, and how are they doing that more efficiently than the human CPU can?
Raad: Actually, the technology for processing and analysis is starting to become fairly attainable to everybody, and a lot of organizations already have the infrastructure to support it in the form of data lakes and streaming data processing.
At this point, most companies that use drones are in batch mode. They fly the drones, take pictures or video, then download the data into their data lakes on premises or in the cloud. Some advanced companies are streaming drone footage in real time. More companies will be doing that before long. [See the sidebar, “IoT, Edge Processing Transform Drones.”]
To break through the limits of the human CPU, as you call it, smart companies are using artificial intelligence and machine learning to process drone footage. At the beginning, a human employee labels some of the images—identifying a broken insulator or a leaky valve, for instance. The AI program learns from that and takes over the analysis.
To visualize that analysis, most companies use a geographic information system [GIS], which delivers location intelligence in the form of beautiful, expressive maps. They use the maps to pinpoint where field crews need to take action, such as replacing a faulty insulator or repairing a leak.
Precision from the Air
Cross: We talked about the telecom and utility scenarios. Where else do you see companies putting drones to work?
Carson: Agriculture is an interesting use case. Since drones can fly quite low and deliver high-resolution, multispectral output, some agricultural companies and farms are using them to detect crop health—down to individual plants and individual leaves.
An agricultural expert looks at the raw footage, identifies a set of affected leaves, and then artificial intelligence does the rest of the analysis by learning what indicates poor crop health. The analysis is mapped by a GIS which identifies the location and condition of specific plants. In the end, the farmer learns precisely where crops are doing well and where they’re doing poorly, and can adjust treatment with precision. That’s having a big impact on crop yield and the bottom line. When you consider that just one crop disease in one state cost the industry $104 million in a year, you get a sense for why detection is so important.
Raad: And agriculture is an area where drones might provide more than visual inspection. When most people think about imagery, they think about what they see when they look at their house in Google Maps. But remote sensing has long been able to take advantage of other data to do things like sense crop moisture. Drones are adding that type of analysis to their capabilities.
Eyes on Business Expansion
Cross: Don, what are you seeing in terms of drones helping companies manage the growth of their business and infrastructure?
Carson: As companies expand, they’re constructing new facilities, and they’re using drone technology to support expansion. During construction activities, drones can:
- provide status reports on progress
- perform volumetric calculations to show when building materials are running low and need to be restocked
- and reveal potential risk areas on a construction site
There’s a high degree of human involvement in site inspections, so drone-based surveys typically save money and time.
Another use for drones isn’t in the sky at all. Some organizations are using ground-based and indoor drones to map their facilities. Drones take pictures or lidar images throughout the facilities, and then GIS technology creates maps and floor plans that give employees a common view of the workplace or industrial environment. By combining those maps with data from IoT devices like smartphones or sensors, companies can do advanced routing and analytics on the indoor environment, including patterns of movement, assets, and infrastructure. It’s a whole new frontier for companies in many industries.

Today, drones are primarily extending our vision. It will be very interesting to watch as they evolve to encompass our other sensors, such as noise, aura, and smell.
Mansour Raad, Esri
Assessing Asset Health
Cross: Mansour, are you seeing other uses for drones overseas?
Raad: We are. In one case in South America, a natural resources company is analyzing drone imagery to extract hidden features such as roads. They use artificial intelligence to infer where the roads are, and that helps them create an accurate map of their network and route supplies more efficiently.
In northern Europe, a timber company is using drones and AI to manage resources. They want to see which trees are growing where, and how healthy they are. So they’re using drones and GIS to identify where particular trees are, what kind they are, and—more importantly, based on a combination of photography and lidar data—understand their growth over time.
Drones for Competitive Intelligence
Cross: Historically, some large companies and hedge funds have used satellite imagery to gather intelligence on competitors—noting the status of a new facility, or how much oil a company has in its reserves. Are drones making it easier to gain competitive intelligence?
IoT, Edge Processing Transform Drones
Drone footage processing has already begun to move from batch mode to real time, thanks to powerful edge processing and faster IoT communications.
As that data streams in, GIS technology creates maps that indicate where a company should focus its resources. That might help an insurer dispatch adjusters more efficiently after a storm, or allow an agricultural company to pinpoint crops that need targeted treatment.
“With these new IoT and edge capabilities, companies can get immediate feedback on their assets and reduce time to resolution,” explains Mansour Raad, an AI expert at Esri.
Carson: Yes, certain companies are “spying” on competitors by flying drones above their facilities. The simplistic example is a retailer that flies a drone above a rival store and uses the number of cars in the parking lot to estimate sales. That costs a lot of money to do with satellites, but with drones it’s more manageable.
Another case we’ve seen is wineries. Drones can fly over competing wineries to examine growing conditions, slope, and planting patterns. That kind of location intelligence can be valuable to business executives.
More than Eyes in the Sky
Cross: Where do we go next with drones? Are there any scenarios where the drone won’t simply be eyes in the sky, but will perform a business task?
Carson: Telecom companies are exploring drones as a way to cover gaps in wireless cell coverage. Think of the drone as an airborne cell tower and antenna all in one. This could be especially useful during hurricanes and other natural disasters—providing temporary wireless communications to first responders, for instance.
Raad: Facebook and Google are already experimenting with similar techniques to provide Wi-Fi in developing countries. Facebook has developed solar drones that stay aloft and provide service—although they may outsource that work. Google’s Project Loon—which is now its own company under the Alphabet umbrella—uses balloons to provide wireless connectivity.
Amazon hasn’t been shy about wanting to deliver packages by drone, and some logistics providers are planning their own fleets of drones for last-mile deliveries.
Perfecting all these applications will require a high location IQ, because you can’t get the right products to the right people without reliable location intelligence.
Growth Insights: Getting Ahead of the Country’s Changes
Authors James and Deborah Fallows share insight on how America is changing, and how cities outside the mainstream are playing a vital role.
People and places are changing. Business executives looking for signals of what’s to come in the next decade may be intrigued by the perspective of James and Deborah Fallows.
Over the course of five years, the married writing duo explored the United States one small city at a time. They turned their observations into the bestselling book, Our Towns.
The Fallowses recently sat down with WhereNext to share some of what they learned. While both are quick to note that they are not business analysts, the trends they observed are worth noting for business executives.
Contrary to the narrative that all top young minds are flocking to big cities, the couple found talent and passion abundant in the nation’s smaller urban areas. Their observations hint at a country whose economic centre may become noticeably more diffuse.
Sensing Trends in Location, Talent
WhereNext: You spent time as a speechwriter [for President Jimmy Carter]. If you were making a speech to a business executive about what you learned from your travels, what would you say?
James Fallows: I would say that there’s a historic wave they want to get ahead of rather than behind—a wave of young, technically-savvy people wanting to live in, be part of, and help create a real place. Not just to be one more person in the Bay Area scrum, but to be helping to build Fresno or Spokane or Duluth or Greenville or any of these other places.
Not everybody will be interested in doing that, but a lot of people will. The real estate advantage is there. The connections are there. There’s a pool of talent looking for places [where] they can be involved and have a different kind of life, and there are all these local opportunities in things like agricultural technology in the middle half of the country, and places with a manufacturing heritage.
The combination of several trends makes this a uniquely advantageous time to look into the rest of the country for locations. Partly, there is a negative force: simply the cost of working in the biggest cities. The cost of real estate in half a dozen cities in the US is crippling and it sort of destroys everything else in your life or business. In the rest of the country, the cost of real estate is much less. It just means you have a head start. You kind of start out going downhill in your business operations.
The Early Stages of the Business Cycle
WhereNext: The business cycle tends to start with an individual and a dream. But as small businesses grow, big businesses take notice and make acquisitions—as with craft breweries, for instance. Did you see the early stages of that cycle in some of the locations you visited?
Deborah Fallows: I was struck in many of these towns where, [for families] opening the craft brewery, the intention was to make a viable business for them and their young family so that they could stay in Duluth or Fresno or Winters, California. Actually, [these business owners] seemed to have a very slow and conservative approach toward their goals. The end of the dream was not to build a giant brewery and be acquired. The end of the dream was perhaps to have a couple breweries in the town, or to expand and grow the one they have.
This was part of their bigger picture: being in a community where they could raise their kids and create a balance between their work and family and civic activities.
With deliberate, slow growth, they could maintain a balanced life and not get into a place where they either risked their business or risked their lifestyle. A small-town, successful enterprise could integrate into the town.

Compared with the days when we were growing up, it seems like there are so many more small businesses starting around local products and themes. Young people are often taking the lead.
Deborah Fallows
The brewery in Duluth is really a good example of that: two young couples, who now have little kids who are elementary school age, starting the Bent Paddle Brewery. They talked a lot about being part of that community and being in a position to have the kind of leadership to make the schools strong, make the recreation fun, make it a nice place for kids and families to grow up. But they didn’t talk about, “We’re going to make this brewery into a fantastic place and sell out to Pabst Blue Ribbon,” or whatever that might be.
Fostering New Business Growth
WhereNext: How does a particular location foster business growth? Where did you see that playing out?

Deborah and James Fallows discuss their travels at a recent conference.
James Fallows: I think you’re probably aware, from the Kauffman Foundation report, that all of the net job growth in the US economy is from businesses in their first five years of life. So what matters for having a growing job base is new businesses.
I’m thinking of places where we saw new manufacturing bases—Louisville and Erie and Duluth and Wichita and also Mississippi. There was a deliberate fostering environment. There were community colleges and universities where they had extension programs, and some community financing networks in Duluth.
We saw a lot of cooperative efforts that succeeded. In Duluth, with its furniture manufacturing and kitchen utensil and aircraft-component manufacturing, and then the huge aircraft works, all these were results of deliberate fostering efforts.
WhereNext: Were there other specific efforts that stood out to you?
James Fallows: In Wichita, there was 1 Million Cups. It’s a network to get people connected, and get them going. Again, this sounds obvious, but standard economic theory assumes everybody is working just on his or her own, independently. Political rhetoric usually assumes that, too. So, simply the idea that success requires these informal networks was impressive, and every place we saw that succeeded, they had those.

There's this resurgence of locally conscious, walkable, downtown-based enterprises that we saw.
James Fallows
One other point is that in a lot of these [smaller] cities–it’s not that they were doing special favours for a business, but they are in the mood to get things done as opposed to not get things done. Of course, there are city governments where that is not the case—for example, if you lived in Washington, DC, or in San Francisco. But Columbus, Ohio, is very notable [for] just saying, “Okay. We are the scale where we can make things happen. If you have a problem, we know how to make it fixed.”
Finding the In-Between Places
In planning their journey across the United States, James and Deborah Fallows used a geographic information system (GIS) to map out smaller cities with similar economic challenges.
“GIS was an important part of our understanding where we were going and trying to envision” the economic realities of those locations, says James Fallows. The location intelligence delivered by GIS helped steer the authors toward places outside top-tier cities, where they could observe burgeoning businesses and a set of priorities different from those of people in major cities.
Deborah Fallows: And the network within a small town [is important]. The old cliché is it takes a village to raise a child. [This] seemed to be the case of “It takes a village to start this business here or make sure that it is nurtured,” that we saw in towns that were as big as Columbus, Ohio, where the city government has a small business concierge to help all the young entrepreneurs with food trucks, for example, navigate the laws and the rules so that they had a much better chance of succeeding than not.
The Characteristics of Success
WhereNext: A lot of cities have hard-luck stories, and a lot of cities have good, accomplished, smart people trying to turn them into better stories. But they don’t all succeed. Did you see anything notable in the people who managed to succeed?
James Fallows: I think this will sound clichéd, but I think it’s true: Success was not directly related to academic credentials, or necessarily even being schooled in a certain discipline. It was impressive that the simple will to make something happen seems to be the most important thing.
Deborah Fallows: [In Eastport, Maine, and elsewhere] people have an impulse to say yes to a challenge no matter how weird it sounds. For example:
“Would you like to receive 1,000 pregnant cows to ship to Turkey?”
“Yes.”
“Okay.”
“Okay. Now what do we do?”
It’s seeing an opportunity, whether it’s something that comes across the transom like pregnant cows, or if it’s a passion, [and saying,] “I’m just going to make this happen,” and then having the patience and determination to do it.
To hear the Fallowses’ perspective on how location intelligence is helping smaller cities make data-driven decisions, listen to this podcast.

The Secret Formula behind One of the World’s Biggest Business Expansions
How does a company decide where to locate 2,500 new stores in one year—and ensure profitability? One retailer reveals the answer.
Any successful business aims for growth. It’s all about increasing sales, improving the bottom line, adding new locations, and beating last year’s performance.
That may take the form of a modest goal, such as opening a new store, or a more aggressive one—say, launching a dozen outlets. But what if the ambition is far greater? What about opening 2,500 stores in one year, even in a global economy that’s bending toward online sales and away from brick-and-mortar retailers?
That’s the task facing Igor Pletnev and his colleagues at X5 Retail Group, which is traded on both the London and Moscow stock exchanges. They discovered the only way for their company to dramatically expand was to ramp up its technological capabilities.
“In the last several years, we have managed to make a tremendous leap forward in terms of the numbers of opened stores,” says Pletnev, the company’s strategic business development director. “Those newly opened stores were good openings, high-quality openings. The percentage of mistaken decisions is very low, so we are very much satisfied with the result.”
That performance has helped make X5 the top retailer in Russia by revenue, with a market cap of more than $6 billion.
In the past two years alone, X5 has opened more than 5,000 grocery and convenience stores—a 50-a-week pace it intends to continue this year and into the future. The growth acceleration, which outstrips anything in the US retail market, has raised X5’s total store count to more than 13,500.
But until recently, X5 was lucky to open 500 stores a year. The key to the company’s explosive growth, Pletnev says, has been its extensive use of location intelligence—a form of business intelligence that helps a company see and predict trends in geographic areas. X5 draws its location intelligence from a geographic information system (GIS). That technology, Pletnev says, is helping the company make more profitable decisions about how and where to grow.

Location intelligence forms the backbone of X5’s growth plans, contributing to the top and bottom lines in interesting ways. For instance, executives and managers use insights from location analytics to stock stores with the right products and negotiate more favourable lease rates from landlords.
Location Intelligence Drives Profitable Expansion
Growth at such an impressive scale is fraught with risk and ripe with opportunity. To mitigate the risk and bolster the potential, X5 uses location intelligence to create what it calls high-quality openings.
With GIS as its mapping platform, X5 analyses potential locations for single stores as well as groups of outlets across a region. And location is everything when the goal is to place 2,500 stores in one year.
Leading retail companies often rely on GIS to assess the demographics and psychographics in areas of potential expansion. If residents of the region match the profile of those the company seeks to serve, executives may opt to open a new store. X5 takes that analysis to a new level, making hard-dollar predictions that guide decisions.
The publicly traded company uses GIS to create two critical decision support tools: a heat map and a development roadmap. Together, these maps form the basis for X5’s three-year growth plan.
The heat map shows an automated calculation of a potential store’s revenue. Would-be stores are colour coded, with green representing most profitable, followed by yellow and red. Under the hood of those simple displays are complex analytics capabilities (see image). The estimates inform the development roadmap, steering X5 toward profit and away from risk. And it seems to be paying off: the company’s 2015 profit was 14.2 billion rubles—$233 million at the 2015 exchange rate. By 2017, it had grown to 31.4 billion, or $538 million in 2017 dollars.
“The most important extra function is this estimation model, which assesses the amount of revenue for a potential site,” says Alina Prigozhina, who was head of X5’s GIS team from 2014 to 2018. “It can count how many people live around this potential site. It can estimate how competitors affect this exact site.”

A heat map showing business potential for prospective X5 locations
Every February, two teams of managers from every region—one representing development, the other operations—up to 300 people gather to update the heat map with marketplace changes not captured by prior calculations. The new heat map shapes the development road map with target revenue for possible stores. That document becomes the foundation for the three-year development strategy, Pletnev says, which guides the entire company.
“The system helps us to choose the best-case scenario in relation to a group of stores, which is important [for] understanding them holistically,” he notes.
Using location intelligence not only to assess an area’s potential but also to predict a store’s revenue is a sophisticated technique, according to Tom Horan, dean of the business school at the University of Redlands.
”Our research shows that 20 percent of companies are spatially mature, which means they leverage location intelligence to improve decisions across the organization,” Horan says. “X5 stands out even among those leaders. Their use of GIS to predict the business impact of location decisions is a model that other businesses are likely to follow.”
Democratizing Data to Propel Growth
Once the growth committee determines a master plan, it falls to a group of regional directors to scout new store locations. Each regional director—there are 170 across X5’s geographic footprint—oversees a portfolio of 80 to 110 stores. Their focus, Pletnev says, is on quality, not quantity.
“We want a regional director to focus the attention of the whole operating team on a high-quality opening of each new store,” he explains.
The Bedrock of Growth
Growth on the scale achieved by X5 Retail Group is propelled by digital tools that automate traditionally manual processes such as site selection. To learn how other leading companies have benefited from digital transformation, explore the eBook, Making Sense of Digital Transformation.
To do that, they use GIS to analyse a proprietary blend of location data, including income levels of area residents, travel distances to a proposed store, and the area’s competitive dynamics.
They also use GIS to determine whether an alcohol license can be obtained from the government. A store that’s close to a school, for example, would not be a candidate to sell beer, wine, and liquor, which can otherwise be lucrative.
“Our model,” Prigozhina says, “can sum up all these factors and predict the amount of revenue that we can expect, based on the benchmarks of nearby stores we can forecast potential profitability level. It helps a lot to make decisions about this point.”
Decentralizing X5’s development efforts—and expanding employees’ access to GIS—has accelerated the company’s growth rate by a factor of five, Pletnev says.
Across the company, some 800 professionals access location intelligence generated by GIS each day, he says. That includes individual employees on the ground looking at possible locations, middle managers such as regional directors who crunch potential sales numbers, and the committee that makes final investment decisions. This represents almost every department in the company, from operations and marketing to supply chain, finance, and development.

Members of the X5 Retail Group analytics team.
“Each person who takes part in the decision-making can see the same data,” Pletnev says. “So nobody can send different letters to different people containing different information about the same object.”
Divergent Markets
Russia’s grocery and convenience store business is markedly different from its US counterpart, which has numerous regional, national, and international brands fighting over a relatively stagnant marketplace.
Buffeted not only by online retailers but also by a glut of brick-and-mortar space, American store owners are shuttering locations, including 105 million square feet in 2017. Yet the U.S. still has the highest rate of retail space in the world, according to Credit Suisse: 21.5 square feet per person. Runner-up Norway has just under 10 square feet per capita, while Russia has 1.3 square feet per capita.
In the US, discount chains like ALDI and Lidl are moving in, ramping up the competition and putting more pressure on the bottom lines of major chains such as Kroger and Publix.
But in Russia, X5, Magnit, and other food retailers are rapidly growing and competing in various local and regional markets. In many cases, there is plenty of room to expand, especially in less populated regions like Siberia. X5 has large concentrations of stores in Moscow, St. Petersburg, the Urals, and Central Russia.

It’s important that we can believe in the result of our revenue forecasts for new sites. We have seen accuracy of 90-95 percent from this forecast.
Igor Pletnev, X5
Retail Group
Location Intelligence Reveals Best Store Format
X5 offers three types of stores in Russia. The Pyaterochka string of convenience stores makes up the largest segment of the company. The Perekrestok chain consists of supermarkets. And the Karusel hypermarkets offer both groceries and department store items. (See the sidebar, “Catering to the Customer’s Mission,” for more information.)
Location intelligence helps managers select the right store format for each location—a practice known as best-use analysis. In some areas with strong economic and demographic trends, GIS might indicate that all three stores can coexist and still yield a profit. But in less affluent locations, that mix won’t work because one brand likely would cannibalize the sales of another, Pletnev says.
Directors use GIS to help make the call on the type of store X5 opens by delving into per capita income, population density, and the all-important availability of parking. Parking matters less for convenience stores, which are located within walking distance of most customers. But for supermarkets and hypermarkets, parking is crucial in determining a successful store location.
X5 planners also use location data to optimize current outlets. They analyse each location’s sales volume, shoppers’ buying patterns, and data on where customers live or work. This analysis has led to the renovation of more than 3,000 stores across the country, Pletnev says. In some cases, X5 changes store layout and concept; in others the company downsizes. It all depends on what the location data shows.
Right Products, Right Location, Right Price
Location data even determines which products are stocked in each store. “It helps us to better adjust assortment of the store,” Pletnev says, “and avoid keeping a long tail of products or items which may be in lower demand in that particular store because they do not fit generally the store’s mission.”
As part of that process, the X5 team uses location technology to plot what Pletnev calls “geographic markers.” For example, if there are parks or leisure areas nearby, a store will carry picnic foods and refreshments. Regional and local customer preferences are important too, and are added to the product mix. That has resulted, Pletnev says, in a line that is roughly one-third locally sourced.
Catering to the Customer’s Mission
X5 stores typically fulfil at least one of four customer missions:
- Picking up items for immediate consumption, such as a quick drink and sandwich, best handled by a Pyaterochka convenience store
- Replacing or replenishing food that is regularly eaten at home, a task for Pyaterochka and Perekrestok grocery stores
- Buying food for dinner that night, available at a Pyaterochka or Perekrestok
- Finding special items for a celebration or making a big family purchase, typically found at a Karusel superstore
Using location intelligence technology, X5 analyses local shopping needs and factors those into the decision of which store format will work best in each location.
Pricing for store items is recommended by a GIS analysis of localized economic data. For instance, some items are sold at a cheaper price in less affluent areas, with more expensive products not stocked at all.
Controlling Costs as the Company Grows
While growth remains X5’s top priority, the company also uses location technology to reduce expenses and increase efficiency. Company officials have used GIS to analyse up to 10,000 store leases to determine the optimal rent for each location, crunching factors such as local business conditions and nearby lease rates. So far, they have renegotiated 1,500 contracts.
If a landlord balks at the lower rate, X5 can mine its database for a more favorable deal elsewhere. The company has relocated 100 stores in recent months, Pletnev says. “Optimizing our lease costs is a very important bit of work for us, as the company already has quite an extensive footprint in Russia,” he says.
Earlier this year, X5 opened its website to potential landlords, allowing them to notify the company if they have property for rent. Pletnev says the site records hundreds of entries per day—all of them fed into the GIS.
“This service helps the landlords realize what would be the relevant lease rate for the property, and then subsequently they can lease this property to us,” Pletnev says.
It also speeds the leasing process because X5 managers do not have to go out and scour a region or neighbourhood for potential locations. Instead, they can look them up on their computers and phones.
“The landlord,” Pletnev says, “could mark his facility as ready to lease, and the system will generate the message to the person responsible for development in that particular area that another facility is available for lease.”
Prioritizing Quality Growth
A company adding a smattering of stores each year can rely on local knowledge for insight on which type of store to build where. A company adding thousands of stores a year needs analytics of a higher order.
Before GIS, as many as one in four stores might have opened in a less-than-ideal location or may have stocked the wrong items. Pletnev says location intelligence changed all that.
“The system,” he says, “helps us to choose the best-case scenario.”
With fewer missteps, X5 now deploys its capital more effectively, freeing up funds for more store openings.
Today, X5 stores serve roughly 11 million customers. Inevitably, the time will come when expansion slows. At that point, Pletnev says, the company will further concentrate on efficiency and increasing per capita spending in each outlet.
For now, with more growth on the horizon, the X5 team is moving quickly yet prudently.
“To us,” Pletnev says, “it’s not the quantity, but the quality that matters.”
For more on how retailers are turning location intelligence into competitive edge, listen to this podcast with Retail TouchPoints’ Debbie Hauss.

Tech Startup Lends Fuel to the Nationwide Popup Trend
Houston-based company expands, matching short-term storefronts with companies seeking to promote their brands and deepen customer loyalty.
Tech startup PopUp Shops is expanding beyond its native Houston, connecting businesses with short-term retail space nationwide, according to a recent article in Houstonia magazine.
Likening itself to the Match.com for brands seeking spaces, PopUp Shops capitalizes on retail closures to help companies connect with customers. Popup stores are growing in popularity as manufacturers and brands look for direct-to-consumer opportunities. These temporary spaces offer a place to test the market for products and reach new, often younger, consumers.
PopUp Shops uses online maps to reveal available locations and details such as daily rental rates. Some of the agreements it facilitates can be as short as five days—just enough time for the renter to hold a flash promotional event.
Locating the Right Audience
For businesses, popups can serve as marketing research labs—a place to evaluate new-product appeal through real-time customer feedback. But before opening their temporary doors, brands must determine whether a retail location will attract its target customers.
Making Sense of Digital Transformation
Retailer leaders and companies across industries are incorporating digital transformation and location intelligence into their workflows. To learn how they’ve improved decision-making with these tools, read the eBook, Making Sense of Digital Transformation.
In search of areas with the greatest short- or long-term potential, data-driven companies use customer segmentation and location intelligence technologies to determine the consumer makeup of a prospective location. Through detailed analysis of demographic and psychographic data, a geographic information system (GIS) reveals what categories of consumers live in an area and their potential affinity for certain products or brands.
Because of its temporary nature, a popup store lowers the renter’s risk and commitment while delivering valuable location-based data of its own. In-store cameras can record anonymous foot-traffic behaviour, revealing which products or displays draw the most attention from visitors. Store staff can interview popup visitors to gauge their reactions to the experience and to specific products. When that feedback is plotted in a GIS, it unveils regional preferences for certain products and services, helping the brand create localized merchandise plans and reduce deadweight inventory.
Short-Term Appeal Spans Industries
The popup experience is not restricted to retail. Restauranteurs have set up temporary kitchens in parks, plazas, and galleries to introduce diners to new chefs and menus. In London, frozen-food purveyor Birds Eye opened a short-term restaurant and served dishes created with the company’s products. Diners paid their tabs by taking a picture of their meal and posting it on Instagram.
Popup shops are a product of a fast-moving economy and consumers who push businesses to stay relevant. Forrester principal analyst James McCormick calls this the age of the customer, noting in a recent podcast:
We’re in this age where the customer’s more empowered than ever before, and actually more powerful than the brands when it comes to managing the narrative of the discussion and the engagement with the brands.
Manufacturers, brands, retailers, and other businesses must innovate faster than ever to attract customers and build relationships. The popup model offers short-term venues for companies to test products, redesign customer experiences, and collect valuable location data. Popup Shops’ recent expansion serves as an indication that this short-term option may just be here for the long term.
Listen to Debbie Hauss, editor-in-chief of Retail Touchpoints explains how companies use location analytics to keep customers coming back for more, in this podcast.

Life Coding “Will Change Every Business on the Planet”
Digital transformation has been a seismic shift for companies. Now ‘life coding’ promises equally profound changes for business, expert says.
“Imagine my standing on stage 30 years ago and saying, ‘Every business on the planet needs to understand that if they don’t go digital, they’re dead.’”
Today, Juan Enriquez is saying something equally revolutionary to business executives: the emerging practice of life coding will fundamentally alter how businesses are run and products created.
Enriquez is a managing partner at venture capital firm Excel Venture Management. The company’s strategic advisory board is a who’s who of life sciences luminaries—among them a former chief strategic officer at Merck, scientists from Harvard and MIT, and Nobel Prize winners. Excel was founded in 2007, and startups that have passed through its portfolio are now owned by the likes of Quest Diagnostics and McKesson.
Enriquez, a futurist, was also the founding director of Harvard Business School’s Life Sciences Project. As such, corporate executives may want to listen when he forecasts what’s next for business. Enriquez says digital transformation is now the price of entry for any company—a must-have rather than a leading-edge practice. And he believes life code is the new digital. Exxon and other heavyweights seem to agree (see sidebar).
WhereNext sat down with Enriquez to discuss an emerging future for business leaders.
The Business of Life Code
WhereNext: If a business executive—say, the CEO of a consumer product goods company—were in the room during one of Excel’s investment discussions, what would they hear that would affect their long-term planning?
Enriquez: When we moved from a molecule economy and an analoge economy to a digital economy, it seemed absolutely irrelevant to most consumer companies for a long time. [Their thinking was], “I sell toothpaste. These computer geeks, they’re off in Silicon Valley and they work on Wall Street stuff and they work on defence stuff and they work on data processing stuff. But I sell toothpaste.”
You try and sell toothpaste today without using ones and zeros—in your sales data, your maps, your product design, your global supply systems, your design capabilities. Ninety-nine percent of the world today speaks a language that I wasn’t speaking in high school. There were a few kids speaking it in college. Bill Gates left [Harvard] about two years before I got to college, and [Steve] Ballmer left the year I got there.
We’re now changing language [again]. We’re starting to understand not just digital language but life code and how you can make things by altering living things. That will change every business on the planet.
It will change how and where we make protein; it won’t be done in huge acreage. It will change how and where we’re going to make animal feed, vaccines, petroleum; how and where you store information; how and where you make everything on earth.
It’s a very powerful system because this software makes its own hardware. I can’t leave a cellphone by my bed and have a thousand cellphones. But if I leave a bacteria that makes gasoline, I’ll have a billion copies. [See the sidebar “Oil That Produces Itself.”]
The New Digital Transformation
WhereNext: What does that mean for companies that are just now embracing digital transformation?
Life Code Exhibit A: Oil That Produces Itself
Researchers at Synthetic Genomics, an Excel-backed company, have worked closely with their counterparts at Exxon for the past decade to create oil from algae. By tinkering with the genetic code of certain algae, the scientists have induced the bacteria to produce oil that can be converted into biofuel for vehicles and other applications. The research is now focused on scaling production to industrial levels, with the goal of coding algae that can produce 10,000 barrels of oil every day by 2025.
Enriquez: Well, imagine my standing on the stage 30 years ago and saying, “Every business on the planet and every country needs to understand that if they don’t go digital, they’re dead. That if they don’t understand digital economy, they will be out of business.” People would have looked at me and said, “What are you talking about? I’m a newspaper company.”
What I say today is: “Every business in the world is going to be dependent on understanding what life code does.”
WhereNext: How do you explain life coding to a businessperson?
Enriquez: It depends on what business the person is in. The ability to program cells to make things is far more powerful than the ability to program computers to make things, because cells can make almost anything—they have made almost anything. Everything you see on earth that’s alive or is a byproduct of life, it’s been made by cells. We now know how to write programs to make cells execute specific things.
We know how to read genomes, copy genomes, write genomes. That’s where computers were [in the] ’90s, before [they helped] create the world’s largest companies. We’re now getting to the point where we can scale [life coding]. We can do that with food; we can do that with information storage; we do it with vaccines, antibiotics. We can do it with almost any business on the planet, actually.
We’re going to see [these new capabilities] change some very big companies—any ag company, chemical company, energy company, information processing company. The ability to map life code is going to be really important.
The Right Innovation at the Right Time
WhereNext: When you’re investing in new ideas, you need to know not just what will change the world, but when. How do you sense when it’s the right time to invest in an idea?
Enriquez: Usually I’ll research and write a book for about five or six years, and that will give me some sense of where things are going. Then I’ll figure out what to do about it. I wrote one of the first books that argued that the ability to read life code, like genomes and proteins, is going to change the planet. And that was written before the human genome was sequenced, before most people knew what the word genomics was.
On Living Forever
In Silicon Valley and around the world, there’s an ongoing effort to defeat death. Known in some circles as the longevity industry, it involves smart entrepreneurs who believe that humans should live forever and who are searching for the ultimate life hack.
Venture capitalist Juan Enriquez keeps one foot on the ground. “I think every person alive is going to die,” he says. “I think our limit today is probably 120 to 140 [years old].”
Enriquez sees greater longevity not just as possible, but inevitable. “I’m pretty sure we’re going to be able to reproduce every one of our body parts in the same way as you grow another set of teeth, grow a broken bone, grow skin. We now understand life code well enough [that] we’ll be able to regrow every one of our body parts. So the limit is the brain.”
Because of that, Enriquez will focus for the next 10 years on mapping the human brain.
[In the book As the Future Catches You.] I talked about how countries are going to change; how industries are going to change; how medicine is going to change; how mergers between companies are going to take place; how [life code] is going to be applicable to many industrial sectors that people never thought of, like IT and energy.
The Promise of Programming Life
WhereNext: What drives your investments?
Enriquez: We’re trying to pick big problems and go at them. Back when I was in academia, I wrote a case study on antibiotic resistance and [the] stuff terrified me, so I thought, “Let’s see if we can fix this.” Cancer bugs me, so we like backing stapled peptides which may be able to go after a big chunk of cancers.
[My philosophy is that] programming life is one of the greatest challenges and opportunities we’ve ever had, so let’s build the instruments that do that.
WhereNext: What specific challenges are you focused on?
Enriquez: We mostly work on nerdy life science stuff. We think about how the ability to understand genetic code or proteins or how to program cells, can change various things. We make large-scale antibiotics because there’s a lot of antibiotic resistance. By “we” I mean it’s our companies. We’re the supporting cast for very bright entrepreneurs.
We built the first programmable life form, the first programmable cell. We put the first stapled peptides into humans. We are building a machine that hopefully will allow us to read the brain at a thousand bucks instead of six million bucks, with a billionfold increase in resolution [that will allow us] to read thought patterns, diagnose strokes, and help locked-in syndrome—all kinds of crazy stuff.
I think understanding the brain is one of the greatest single maps that humans are going to build, so I want to participate in that.
For a look at how leading companies have harnessed digital transformation, explore this eBook.

How the New York MTA Manages $1 Trillion in Assets
Any executive challenged to “do more with less” will empathize with the New York MTA—and maybe learn from how it has improved subway management.
With apologies to Texas, most things are bigger in New York City. The Big Apple hosts the tallest skyscraper in the Western Hemisphere. It boasts the world’s most valuable sports market. And it manages the largest transit system in the United States. With nearly 9 million bus and train riders every weekday, NYC’s system is more than 10 times the size of America’s second largest, Chicago.
Stretching through New York City’s five boroughs and the surrounding suburbs, the transportation system encompasses hundreds of miles of track, more than 12,000 buses and train cars, and a staggering $1 trillion in hard assets. Those assets range from the signals embedded in tracks to the tracks themselves, along with the bridges and tunnels that form the system’s arteries.
Managing Assets at Scale
For someone who manages $1 trillion worth of assets, Sean Fitzpatrick doesn’t seem ruffled. When the director of enterprise asset management for New York’s Metropolitan Transit Authority (MTA) sits down with WhereNext to discuss the challenges facing the New York subway, he begins with a simple concept. “There’s a huge onus on the MTA to run 24/7,” Fitzpatrick explains. (If subway riders could chime in, they might add, “run flawlessly.”)
Only a few subway systems in the world operate around the clock, every day of the week. Most of those that do shut down overnight devote the time to maintenance work. The MTA has no such luxury.
Perhaps it’s a New Yorker’s gumption that keeps Fitzpatrick calm in the face of such responsibility. But it doesn’t hurt that the MTA has a vision for better managing its vast portfolio of assets. Or that it is beginning to master the tools—including location intelligence technologies—to make it happen.

We have a huge infrastructure, and much of it is 70 to 100 years old. But at the same time, we are tasked with keeping up with the capacity that keeps increasing.
Sean Fitzpatrick,
New York MTA
Billions of Riders to Accommodate
Ridership has declined slightly in the past two years, but the long-term story of the New York City subway is one of growth. The numbers rose from 966 million in 1975 to more than 1.7 billion in 2017. All the while, the subway itself barely changed. In the past eight decades, New York has not added a single major train line. The upshot isn’t hard to imagine. In 2016, the number of subway delays blamed on overcrowding was four times what it was in 2012.
In recognition of those conditions, the MTA had been working for years toward better asset management. In one of the world’s largest subway systems, it’s no small feat to understand where every asset is located, let alone keep each one in working order to ensure that millions of hard-to-please New Yorkers can crisscross the city every day.
A recent series of high-profile stumbles, including a train derailment, delays, and repeated power outages, prompted New York governor Andrew Cuomo, putative head of the MTA, to declare a state of emergency for the subway. In issuing the notice, Cuomo gave the MTA two directives: immediately address the subway’s most egregious problems, and create a long-term plan to bolster the system’s capability.
Billions to Spend—With a Catch
Most executives would give up their company parking spot for a spending account the size of the MTA’s. But few would sign on for the challenges that accompany the $30 billion allotment, Fitzpatrick says.
“Even though our budget sounds big, when you’re talking about $1 trillion in assets, it’s limited in what it can accomplish in a system as large and complex as ours. We have to make sure we’re spending money in the right way.”
When assets broke down, the MTA’s traditional approach was to mount up, assembling a crew of trade workers including:
- A safety team to monitor the work and communicate with a subway control centre
- Signal electrical engineers
- Track mechanical engineers
- Track electrical engineers
The workers were costly and often difficult to coordinate. The break-fix routine was papering over the system’s ills and draining the MTA’s budget.
“When you fix something after it has broken, it’s three to four times more expensive as opposed to having done something either preventatively or predictably,” Fitzpatrick notes. “So, we’re on a journey to move from reactive to preventative to predictive, ultimately.”
As part of that shift—and in response to the governor’s mandate—the MTA committed to mustering work teams more efficiently, deploying them to work sites with precision, and helping them accomplish more while they’re together. To do that, managers and work crews needed location intelligence.
Addressing Repeat Offenders
At the heart of Cuomo’s state of emergency is the system of signals and switches that safely guide trains through tunnels and between stations. Anyone who has ridden a subway more than once has probably experienced it: The train stops in a darkened tunnel, and the conductor announces, “We’re waiting on a signal to proceed; we hope to be moving shortly.”
Those delays can be the product of normal traffic, but in New York City they often stemmed from a defect in a signaling system long past its prime. In fact, some of the subway’s tunnels, tracks, equipment, and stations are 70 to 100 years old, and some of its electrical cables are sheathed in cloth.
“One of the things that we did almost immediately was we started to use GIS technology to map where the defects were occurring, both in the signals and on the track side,” Fitzpatrick says.
Justifying the Budget
Location intelligence technology is helping the MTA shift to data-driven budgeting. The organization is using the technology to map its assets and maintenance needs, giving executives data to support their intuition.
Now, says Sean Fitzpatrick, head of asset management at the MTA, “we have a much better leg to stand on when it comes to our funding requests. When our senior executives go to Albany to make a case for funding, everything is evidence based. It’s not just a gut feel.”
A GIS, or geographic information system, delivers location intelligence to a range of industries, creating smart maps that analyse data associated with a location: a balky subway signal, a retailer’s same-store sales growth, even the status of planes in transit. Forward-leaning companies are using the technology for asset management in office environments—tracking which conference rooms get the most use and how often maintenance issues interfere with business operations.
For Fitzpatrick and the MTA, the location intelligence gained from GIS revealed opportunities for efficiency they had been missing.
“We were able to see very quickly that there were certain signals and certain sections of track where we were having recurring issues within a very short period of time—days [or] weeks where things were repeatedly breaking down.”
Location Intelligence Yields Action
Once the MTA mapped defects in its signal system, managers moved to better coordinate the repair work itself, including where and how it was performed. They created a GIS-based mobile app for joint switch inspections—the jobs that require teams of skilled craft people.
Now when a manager requests a signal repair, all members of the crew receive a work order on their mobile device. Through an integration with the MTA’s logistics system, it’s clear when the needed materials will arrive on the job site. That, Fitzpatrick says, cuts down on guesswork that had become too common.
“We can actually say, ‘The material is going to show up on Tuesday, so we’ll have the team converge there Tuesday afternoon,’ rather than [saying], ‘Well, the material is going to show up maybe Thursday. So why don’t you schedule it Saturday because it will probably be there by then.’”
With the mobile app, the MTA has also begun to shift from reactive to proactive asset management. For example, a crew manager can use GIS capabilities to find other signals and switches in the vicinity of a scheduled repair. If a similar switch is nearby, the team can perform preventative maintenance while they’re down there, Fitzpatrick says. “There’s a logistical benefit to that, too.”
At the centre of it all is the location intelligence that shows managers where and when the work needs to happen. That spatiotemporal understanding, in GIS parlance, is helping to modernize the MTA’s asset management at a critical moment.
The app has already helped cut the time required for joint switch inspections almost in half. That has helped create “tremendous savings” in costs and improved subway uptime, Fitzpatrick says.

To maintain the subway system in a 24/7 fashion, we have to employ smart technology. Geospatial technology—GIS–is critical to that.
Sean Fitzpatrick,
New York MTA
An Ongoing Digital Transformation
While location intelligence technology helps the MTA log short-term improvements, it’s also fuelling long-term plans. Already, the agency has taken its digital transformation to the sky, using drones to perform inspections of above-ground rails—an efficiency gain over “walking the tracks.”
Underground, track-geometry cars roll through the tunnels like IoT demonstration pods, outfitted with sensors that collect data on track curvature, temperature, moisture, and other physical conditions. The sensor data is fed into the GIS, which logs the location of those measurements, helping managers identify anomalies. But with fewer than 10 specialized cars and more than 600 miles of track to cover, inspections take longer than executives would like.
Don’t Borrow; Hire
When New York MTA executives were brainstorming ways to improve asset management in the NY subway, they hit on one early idea that has paid impressive dividends.
They identified a few key individuals—for example, a track superintendent well versed in joint switch inspections—to join the asset management group full time.
“You have to get a lot of cooperation from the organization to do that,” says the MTA’s Sean Fitzpatrick, “but it’s critical. They can relate to the workforce directly because they were the workforce. That gains us a lot of credibility and gives us a huge jump start in terms of business knowledge.”
So the MTA is working with makers of rolling stock, as subway cars are known in the business, to equip passenger trains with those same sensors for more frequent inspections.
“Feeding that into GIS, we can then look at those [assets] spatially to figure out not just the condition of the track, but are there certain curves where we experience more issues than others?” Fitzpatrick says. Safety inspectors will analyse, for instance, whether certain levels of wear boost the likelihood of derailment on a particular section of track, and whether a slight change in the curvature might reduce that risk. “We’re using GIS to analyse all of that,” Fitzpatrick says.
The MTA wants to use the same technology to create a digital twin of its assets—a virtual 3D map showing infrastructure locations and conditions. If that digital twin were projected onto mobile device screens or augmented reality headsets, MTA work crews, for example, could “see” through the pavement for a bird’s-eye view of tunnels, tracks, signals, and utility infrastructure affecting the maintenance work they need to perform.
That kind of thinking puts the New York MTA in the vanguard of innovative organizations. A water utility in New Jersey, for instance, was one of the first in the world to project a digital twin of infrastructure on augmented reality goggles, feeding its work crews real-time location intelligence. Meanwhile, the largest port in Europe is pursuing its own digital twin vision to prepare for the arrival of autonomous ships.
Whether it’s a smart city, a pioneering port, or one of the largest subway systems in the world, leading organizations are using the power of location intelligence technologies to drive efficiencies, manage risk, capture business opportunities, and make smarter decisions.

Advertising Innovation: Personal Yet Anonymous
Using a new mix of location intelligence and real-time targeting, advertisers deliver personalized messages in the right place.
Brands looking to deliver real-time personalized messages have a new tool. In Los Angeles, billboard giant Lamar Advertising is partnering with two well-known brands on an innovative way to reach customers and prospects in specific locations—all with the help of anonymous data.
In a first-of-its-kind experiment, Lamar teamed with Delta Airlines, fitness club Equinox, and flight tracker FlightAware to create a personalized out-of-home (OOH) advertising campaign, The Drum reports. Lamar obtained anonymous data from Delta and FlightAware showing the flight numbers of planes arriving at LAX from five international and three domestic cities. They used that data to trigger digital billboards near LAX to display tailored messages for arriving travellers, such as: “Just landed on flight DL9293? Sweat the Amsterdam out.” The ad directs viewers to a web page where they can book a “sweatlag” workout—a class designed by Equinox to pre-empt jetlag.
Engagement through Personalization
While personalized advertising is a goal of many leading businesses, companies want and need to be mindful of concerns over how they use personal information. Europe’s General Data Protection Regulation (GDPR) law and the recent data scandal involving Cambridge Analytica and Facebook are two useful bellwethers.
In the case of the Equinox digital campaign, marketing takes an alternative approach, adopting a method of personalization that helps businesses customize messages without breaching customer privacy.
Esri’s Eric Pollard helped define the personalization trend in a recent WhereNext Think Tank interview:
With the advent of digital shopping and e-commerce, mobile device usage, and varied store formats, the era of a one-size-fits-all approach to consumers is over. Department stores have shown us that trying to be everything to everybody without having a targeted focus is no longer a sound business plan.
Against that backdrop, out-of-home advertising is enjoying a resurgence, using measurement techniques and location intelligence to keep pace with advertising on digital channels such as Facebook and other social media.
Marketers at Lamar, Equinox, and Delta are using OOH channels and location intelligence in a new way. They combine an understanding of how people move through the Los Angeles area with novel messages related to personal travel experiences and communicate those messages in real time through billboards.
Location Context and Impact
Companies that master the use of location intelligence to deliver personalized messages in relevant places stand to gain the attention of customers and prospects. In her recent podcast How Data-Driven Commerce and Location Intelligence Are Fueling Retail, Retail TouchPoints editor-in-chief Debbie Hauss suggests that anonymous location data is an intuitive way to make a strong impression on consumers—especially in the world of OOH advertising:
… if I’m walking by a digital sign at a bus stop, for example, it may show some relevant content for me. That is really impressive and that’s really impactful. I think when retailers are thinking about location, they don’t necessarily think about on-the-go [messages]. That’s definitely going to be growing in importance.
To engage consumers, brands must deliver a personalized message at the right time and place. Equinox’s sweatlag campaign demonstrates how innovative businesses are discovering new ways to do that—while, at the same time, making connections with potential customers and respecting personal data protection standards.

Salary versus Cost of Living: A New Report
Median earnings can vary greatly among locations, even for the same job. Business executives should take note for talent acquisition, retention.
Where people live has a significant effect on their earnings. New research by the Hamilton Project at the Brookings Institution is adding depth to this truism, and could induce wage earners to consider relocation—and some executives to rethink where they source talent.
The research shows earnings for a single occupation can more than double between locations. For instance, the highest-paid software developers in the United States work in Santa Cruz, California, and earn $135,000 annually, while the lowest-paid developers work in Lubbock, Texas, and earn $49,600 annually. At the other end of the earnings spectrum, kitchen workers earn the least in Indianapolis ($11,300 per year) and the most in San Francisco ($25,300 per year).
The report arrives as the US economy is expanding but wage growth remains sluggish. As such, the nuance within the layers of data can provide valuable location intelligence for both executives and job-seeking professionals.
Nationwide, the median earnings for full-time workers is $41,000. US wages in the 30 highest-earning locations average 20 percent more than the national rate, and 37 percent more than wages in the 30 lowest-earning locations.
While insight into where earnings are highest could convince employees to move, it also helps employers strategize to retain and attract a talented workforce. This interactive chartaccompanies the Hamilton Project’s economic analysis, “Where Work Pays: How Does Where You Live Matter for Your Earnings?”
Factoring Cost of Living
Dollars stretch further in communities where the cost of housing, food, education, and transportation is below average. In contrast, a high cost of living can often blunt the appeal of higher wages, making it implausible, for instance, that a large group of Indianapolis kitchen workers would move to San Francisco.
Across the country, higher-earning areas tend to have a higher cost of living, while areas with a lower cost of living have lower wages. The news from the Hamilton Project report is that there are exceptions—locations with low overall earnings but pockets of higher wages in certain lines of work, and vice versa. Researchers found that 19 of the 20 lowest wage locations have at least one occupation that pays above the nationwide average.

It costs 11 to 13 percent less than the national average to live in such midwestern locations as Bay City, Michigan, or Toledo, Ohio, making the Midwest one of the most attractive regions for employees overall.
Some companies are using this kind of location data to scout areas of the country with a low-cost workforce and high quality of life. The combination can work to a company’s advantage, as detailed in the WhereNext article on Bentonville, Arkansas, global headquarters of Walmart.
Researchers for the Hamilton Project noted pockets of opportunity. They found that it costs 11 to 13 percent less than the national average to live in such midwestern locations as Bay City, Michigan, and Toledo, Ohio. This makes the Midwest one of the most attractive regions for employees overall.
In the Northeast, the cost of living is higher. For instance, living in Atlantic City, New Jersey costs 3.5 percent more than the national average. However, the wages in the Northeast trend higher, which makes it the second most attractive earnings region overall, according to Brookings.
Cost of living certainly plays a role in how quickly some cities expand. A glance at Forbes’ latest list of fastest-growing citiesreveals several with an appealing combination of affordability and economic opportunity—areas such as Boise City, Idaho; Fort Worth and Arlington, Texas; and Cape Coral and Fort Myers, Florida.
Independent Occupations
Not all wages are impacted by location. Some high-earning occupations, such as computer analysts, cluster in areas like Silicon Valley—to the benefit of both company recruitment and worker compensation. Other job types are location independent, including truck drivers and mechanics.
For occupations in which wages vary across locations, such as registered nurses, the place a person lives has a bigger impact on wages. For occupations with less wage variation, such as truck drivers, location makes less of an impact.
Employers in location-independent sectors (including construction trades, food service, and retail) would see little cost benefit to moving operations from one locale to the next. But in location-dependent sectors (including healthcare and technology), employers outside the highest-wage areas might be able to recruit employees with the lure of a lower cost of living. But those employers also have more to fear from location competition.
This research builds on prior efforts of the Hamilton Project to help workers—especially young workers—use data and location intelligence to inform education and career choices. Mining this analysis can help employees understand the trade-offs inherent to location-based decisions, and also assist executives in recruiting talent, particularly in places outside millennial strongholds.
(Learn how Millennials—and the companies that recruit them—are factoring earnings, cost of living, taxes, and amenities into location-based decisions.)

NJ Utility on Forefront with New Mixed Reality Application
The utility becomes one of the first agencies in the world to combine augmented reality with GIS technology for more efficient fieldwork.
A midsize utility in New Jersey has made the leap to adopt a cutting-edge mixed reality (MR) holographic application while blazing a path for other industries and businesses to follow.
Toms River Municipal Utilities Authority (TRMUA) may just be the first utility in the world to use mixed reality headsets to guide fieldworkers in locating underground utilities. This technological leap brings utilities and other companies with underground assets closer to realizing an age-old wish: to see through dirt. The mixed reality solution is helping field technicians in Toms River close service tickets more quickly and avoid costly repairs.
“This is not science fiction anymore,” says Len Bundra, the IT/GIS director for the Toms River agency, and the person who saw the potential in a mixed reality application.
At its most basic, the Toms River system takes three well-established technologies and combines them into one brand-new application. All three are commercially available - Esri’s geographical information system (GIS), which stores location and attribute information on TRMUA’s underground assets; Microsoft’s Azure cloud-computing service; and Microsoft’s HoloLens. The three were integrated and customized by Meemim Inc., a Toronto-based company founded by Alec Pestov, who previously managed several startups.
Early results are sparking widespread interest, driven in part by the growing excitement and investment in mixed reality applications. As more agencies and organizations see the potential savings and increase in efficiencies and job safety, the use of hands-free mixed reality headsets may set the new standard for avoiding utility breaks while digging, and preventing errors when marking line locations on asphalt, concrete, or lawns.
Just a couple months into the pilot program, it’s hard to quantify savings. But in addition to minimizing lost time, anything that lowers the chances of a utility main break is likely saving tens of thousands of dollars.
The first steps toward this technological leap came in 2005, when Bundra oversaw the installation of TRMUA’s GIS, which included precise (subdecimetre) data on the locations and sizes of more than 400 miles of wastewater pipes. With that rich database and other layers embedded in GIS, Bundra began to wonder how to create even more efficiencies in the field. He eventually found in Meemim a partner that wanted to explore the idea.
The partnership has turned out to be very useful, so much so that the dozens of utility representatives who have seen the TRMUA application in action have been impressed by its capabilities and ease of use and want to know more.
Ready to Experiment with Augmented Reality?
A few guidelines for the journey:
- Decide your use case. Identify a work process or business challenge that augmented reality/mixed reality (AR/MR) technology can improve or resolve.
- Survey the location of your assets with enough accuracy to suit your use case. (For Toms River, that meant achieving subdecimetre precision.)
- Ensure that your GIS database includes reliable attributes for your assets (size, installation date, material, diameter, etc.).
- Partner with other organizations or companies to share data and thus create a richer view of the world through the AR lens.
- Experiment, develop additional use cases, and share learnings with other agencies and partners.
Mixed Reality Technology across Industries
The use of mixed reality or augmented reality (AR) devices in work environments continues to grow.
Goggles, smart glasses, headsets, and helmets that project information, instructions, or images on the wearer’s field of vision are being used by manufacturing and retail companies that build equipment, repair machinery, or want to show customers what kitchens or homes will look like when completed. And the list of the technologies’ applications keeps getting longer.
In December 2016, the Wall Street Journal reported that companies were performing quality checks 20 percent faster and speeding up production by 25 percent with versions of the smart glasses. It also noted that Forrester Research, Inc., predicted that the number of US workers using smart glasses will grow from the current 400,000 to nearly 14.5 million in 2025. The research company also expects spending on smart glasses among large companies to increase from $6 million to $3.6 billion in the same period.
Those numbers do not surprise Cindy Elliott, head of commercial industry marketing for Esri. “The combination of GIS and augmented reality can address a lot of interesting business cases across industries,” Elliott says. “The technology is certainly powerful in outdoor settings like Toms River, but GIS and AR can also create efficiencies in warehousing, real estate, retail planning, and manufacturing.” (See the sidebar for one possible scenario.)
In essence, the use of mixed reality technology and GIS affords companies a new level of operational intelligence, which drives efficiency, increases safety, and can even inspire new service offerings. (Learn more about operational intelligence.)
As word has spread about the Toms River implementation, even utilities much larger than TRMUA—which has 435 miles of underground utility lines, 18 pump stations, and 47,000 ratepayers—are paying attention, and new partnerships are forming around the business potential of mixed reality.
While many utilities traditionally have kept a tight lid on data related to gas lines, electrical wires, and fibre-optic connections, Bundra sees that changing, thanks to the HoloLens project. “This technology is like a caveman fire for people to huddle around ” Bundra says. “When you put on the HoloLens, the more utility lines you see underneath you, the more utilitarian the product becomes. Now we’re suddenly huddling around the fire.”
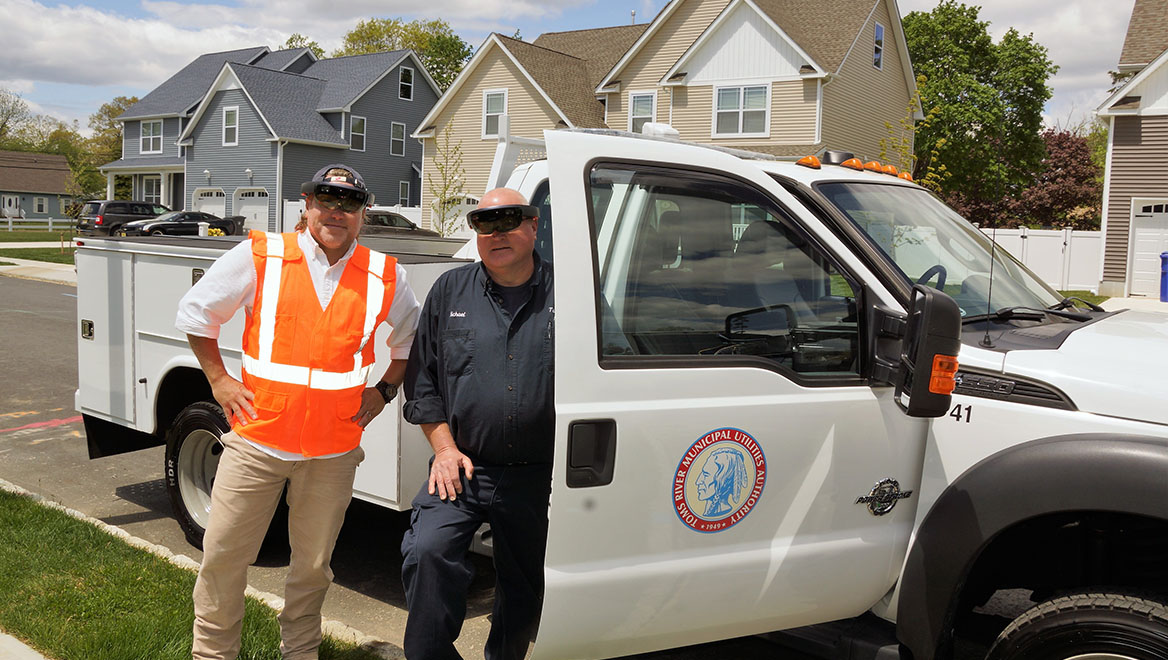
A Huge Potential for Savings
A simple scenario that was repeated several times during the first months of the Toms River project helps illustrate the increased efficiencies of GIS when coupled with the holographic headset.
The holographic headset includes audio, tiny cameras, movement sensors, and a system for confirming the wearer’s exact location relative to the underground pipes. While wearing the HoloLens transparent visor, utility workers see a mixed reality—including the real world in front of them as well as a holograph of the lines of wastewater pipes underground. The pipes are colour coded and projected to scale. With slight movements or audio commands, the wearers can summon screens showing relevant information.
This video offers a brief tour of the MR/AR experience. The relationships among the pipes are made clearer and the ability to gauge depth is much richer with the headset on, but the video conveys the basic functionality.
While wearing the headset, workers operate hands free, precluding trips back to the truck to get their bearings using two-dimensional maps of utility lines, or a tablet computer. And even more importantly, the technology allows fieldworkers to connect with remote colleagues—often an engineer in the office—who can see exactly what the fieldworkers see. This is accomplished through a simple Skype connection. So if the employee in the field—whether marking lines with paint or digging to fix or replace a line—is not sure how to proceed, an engineer or manager back at the office can highlight or circle certain areas where extra caution should be taken, and those marks will appear in real time on the fieldworker’s visor.
For instance, if the manager notices a grouping of utility lines, then the worker may be directed to stop using heavy equipment and start digging by hand until the issue is resolved. In the past, fieldworkers attempted to resolve these incidents over the phone or by summoning the manager from the office to the field—a slow and pricey process.
Having accurate GIS data and engineering help available at nearly all times can avert costly line breaks. A break in any utility line means that work comes to a screeching halt until repairs are made. Many of those problems occur because the aboveground markings are off. “So now a simple two-hour markup just turned into a $23,000 dig up and repair,” Bundra says.
And if the issue happens after business hours, the new application means that fewer employees need to drive to the site and risk exposure to open holes and heavy machinery at night.
But even the avoidance of small issues can add up to big benefits. For instance, a TRMUA worker on a routine assignment discovered a manhole cover that had been paved over. Accordingly, the next version of Meemim software will allow the wearer of the headset to mark the location electronically and then record an audio message to note the data discrepancies and any needed repairs.
From the Ground to the Conference Room
Len Bundra of Toms River Municipal Utilities Authority (TRMUA) sees many uses for GIS data and mixed reality. One involves coordinating the input of various agencies when planning buildings. Through HoloLens or another AR device, “You can have the New Jersey DOT sitting in Trenton, the water company sitting in Parsippany, [and] the MUA sitting in Toms River, all looking at the same mini-map from the same perspective, discussing what’s going to happen to this vacant lot in Toms River when it becomes a four-story condo,” Bundra says.
A Company’s Bridge to the Future
TRMUA’s data is precise. Wastewater pipes are plotted within a decimetre of their position. Indeed, the utility’s GIS helped emergency managers know exactly where wastewater lines were located after Superstorm Sandy blew away or covered up many of the landmarks in 2012.
For companies looking to bring mixed reality technology to their operations, indoors or outside, a richly detailed GIS database makes most applications possible. It can store information on the location of fixed assets, track mobile assets like trucks in real time, and monitor the conditions of anything equipped with a sensor. “Without a GIS, there’s nothing,” Bundra says.
That database of information allowed Bundra and Toms River to pioneer a different approach to operational intelligence, experimenting with MR technology that many people have heard of but few have actually used.
For his part, Bundra relishes the pioneering spirit of the project, as well as its early returns.
“I’m looking at this like it’s 1979 and I’m holding the first Walkman.”
This article was originally published in the global edition of WhereNext.