Blog Archives
Location Intelligence: Driving Client Value Toward What’s Possible
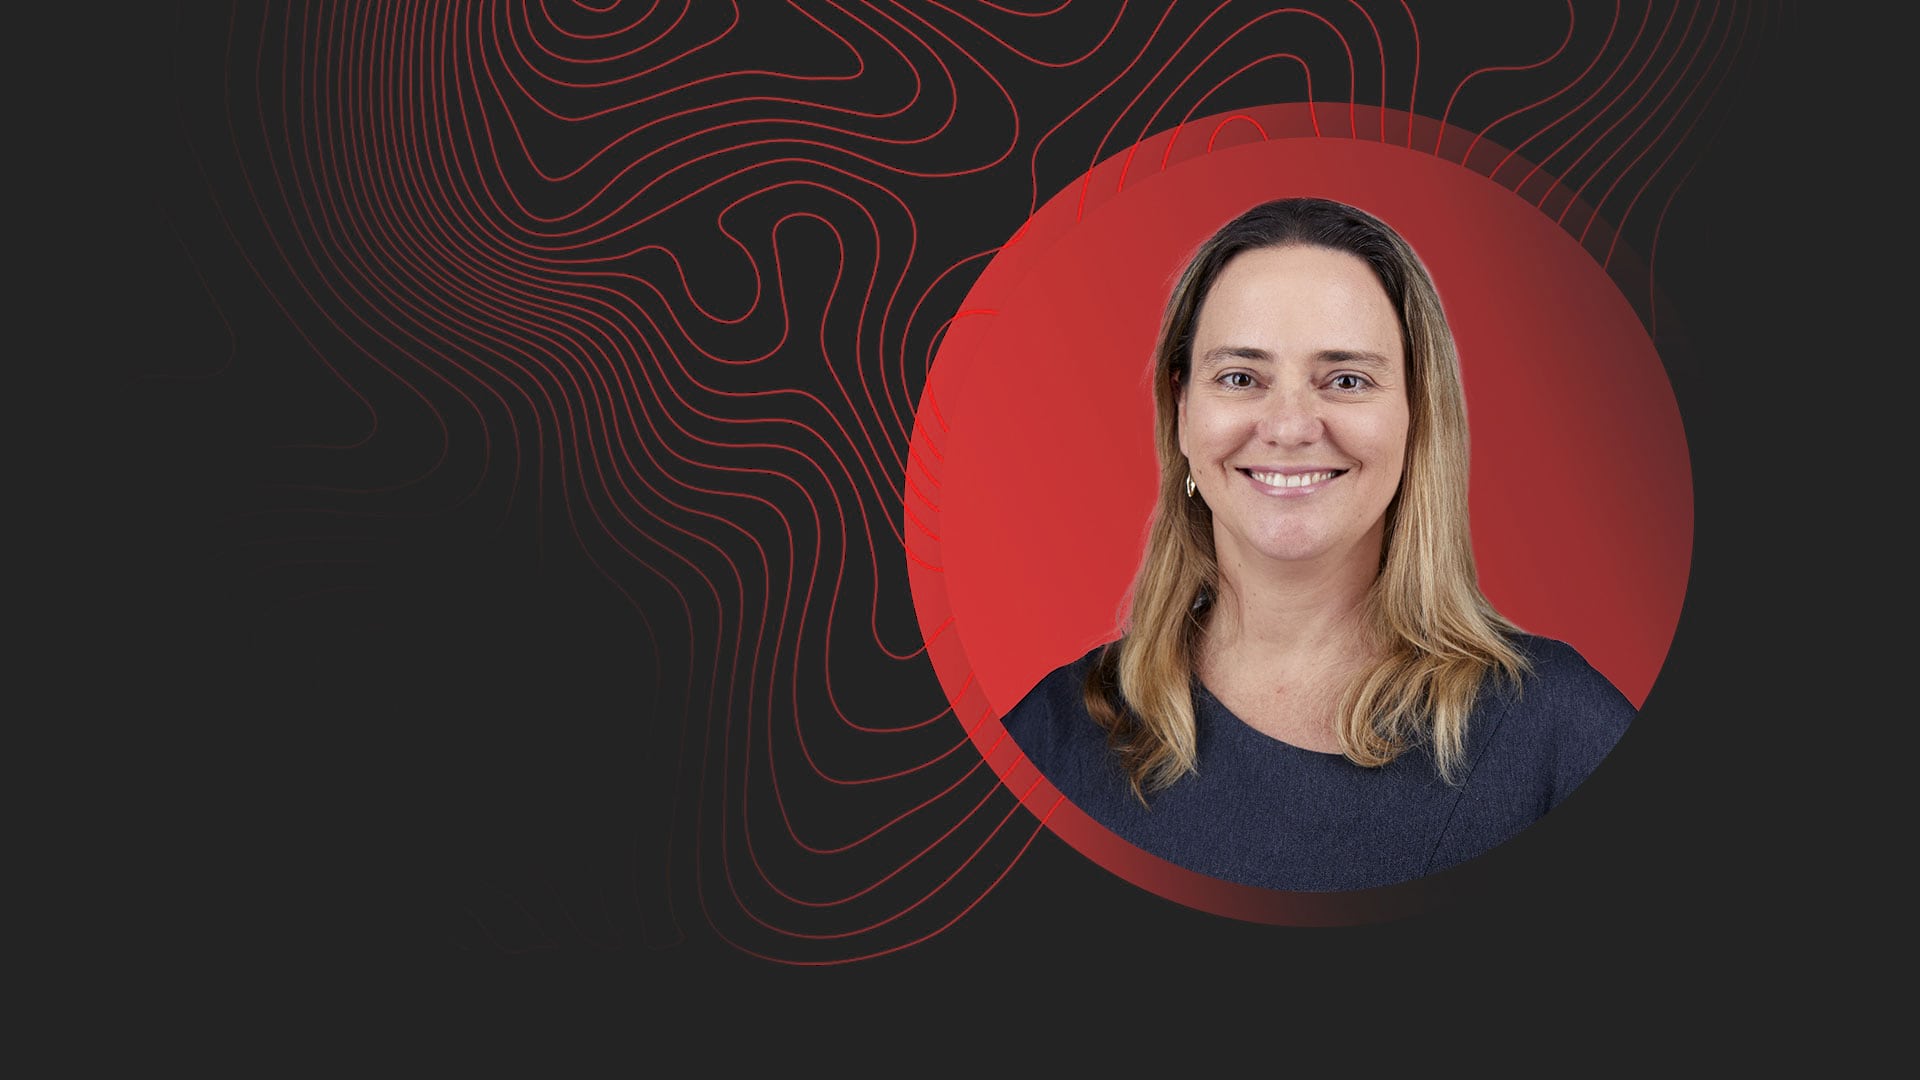
At a top engineering, design, and technology professional services firm, one director sees firsthand the value location analysts deliver.
As a child growing up in Australia, Michelle Watson was influenced by her father’s love of a TV program called Why Is It So? The charismatic host, Julius Sumner Miller, carried out experiments to show curious young viewers how natural phenomena could be explained by the laws of physics. Throughout Watson’s childhood, her father would recount stories and enthusiastically ask, But why is it so, Michelle? It is an approach to life and business that resonates with her today.
“I love to understand why things work and why they don’t work in a different way,” she says. “And that has really fuelled my whole career, I think.”
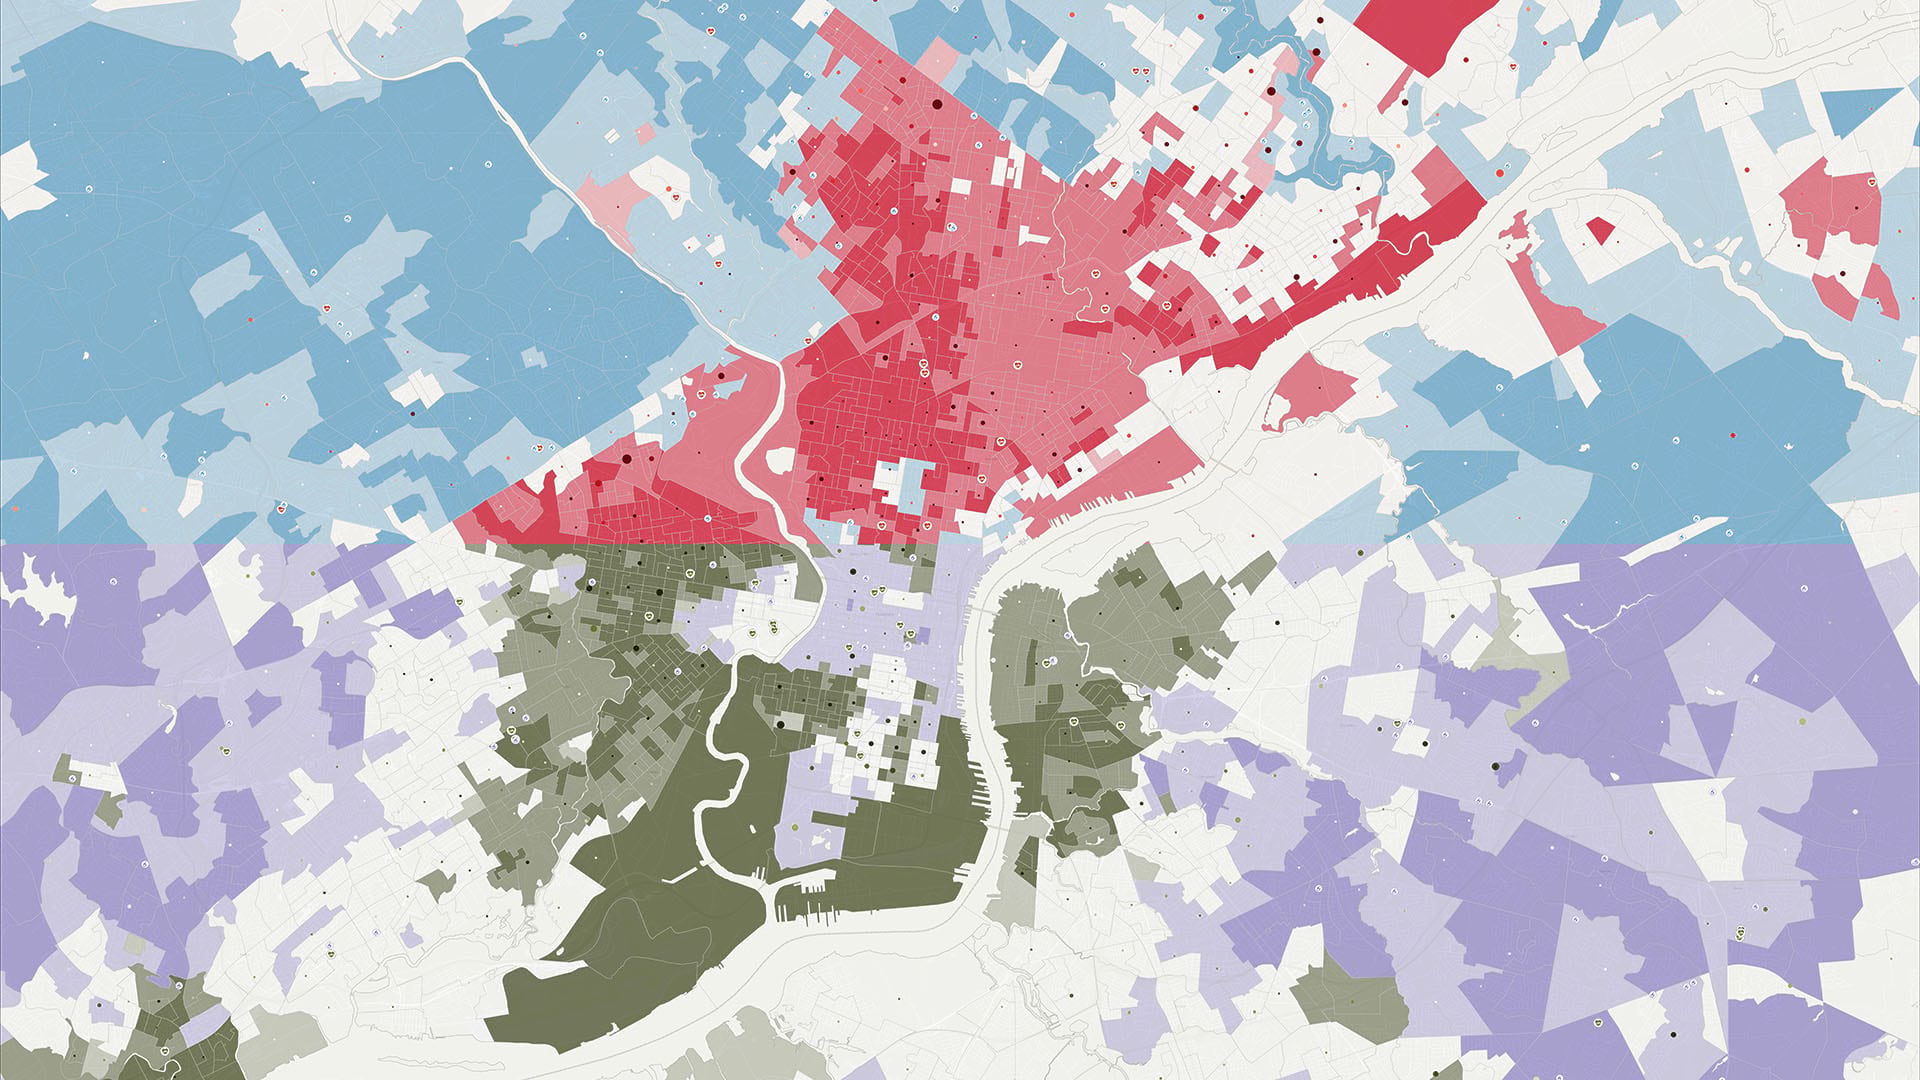
Today, as the global director for geospatial solutions at Jacobs, one of the leading global, full-spectrum consulting, technical, scientific, and project delivery solutions firms, she continues to ask questions meant to unlock insight. Using the analytic power of location intelligence—a form of business intelligence that multiplies the value of location—Watson helps Jacobs’ clients find patterns in data that lead to streamlined workflows, reduced risk, increased work site safety, and new forms of value at the intersection of built and natural environments.
At the centre of her work is a geographic information system (GIS) that models huge, varied datasets into intuitive location intelligence. That might take the form of a smart map of a city showing ongoing construction projects alongside metrics on green space and social equity.
Watson and Jacobs’ location analysts help business leaders arrive at better, more holistic solutions by surfacing important insights from each project’s geographic context. It’s an approach that sees in a defective bridge not just an infrastructure project but a chance to improve the surrounding community, environment, and transportation network by building smarter.
Article summary: As location analysts take a more prominent role in client projects, global full-spectrum consulting, technical, scientific, and project delivery solutions firm Jacobs is finding innovation at the intersections and new forms of client value.
The Art of the Possible
As Jacobs has grown—today it has a workforce of more than 55,000 professionals, with $13 billion in annual revenue—its mandate has broadened, extending beyond core capabilities and into digital domains like cybersecurity and the Internet of Things. In 2019, company leaders named geospatial technology one of the five main areas of Jacobs’ strategic focus, recognizing the potential of location intelligence to create new value for customers and bridge disciplines.
Through location intelligence, “We start to see that the challenges our clients are facing interconnect more so than they ever have before across all industries and client sectors,” says Chrissy Thom, vice president of global solutions and technology. Planning and designing in this era of extreme weather events, for example, requires an understanding not just of how projects have been designed in the past, but how to plan for future weather patterns, renewable energy sources, and the resiliency of construction materials. “That’s where Michelle’s team comes in,” Thom says, “really looking at how we integrate across the tools we use, resulting in a stronger outcome.”
As one of nearly 30 global solutions directors in the firm, Watson is a key adviser on many Jacobs projects. She and her team contribute location intelligence to ventures that range from high-speed rail lines to wastewater treatment plants to smart city planning. In this leadership role, she oversees Jacobs’ 700 location analysts and geospatial experts while helping connect the C-suite in charge of project life cycles with clients. It’s a position that demands both empathy and corporate savvy. “I think my role in the business is a bit of a translator,” Watson says. “I’ve always put myself in the client’s shoes.”
Watson’s goal is to integrate GIS into the planning stages of projects as a platform that can capture input from a variety of stakeholders and model outcomes. She sees older, traditional approaches to project planning—which often include expensive contingencies and reactive problem solving—as no longer sustainable. Projects are becoming bigger; infrastructure is aging; and, especially in a time of pandemic, budgets are shrinking. At the same time, data is becoming cheaper and more plentiful, even overwhelming.
Watson believes that a team of location analysts, using GIS technology, can confront these realities, empowering clients to think three steps ahead. With location intelligence, a client might see how the layout of tree lines will deflect gale-force winds from a coastal building or how property values for new condominiums can be increased by creating viewsheds that highlight nearby amenities.
As the interconnectedness of buildings, structures, and the natural environment becomes more apparent, it’s in the spaces where disciplines meet—engineering, architecture, and environmental science—where the greatest gains can be found.
“Innovation happens at the intersections,” Watson says.
Geospatial: A Realm of Exploration, Innovation
Raised on Magnetic Island, a natural oasis and tourist destination in North Queensland, Australia, Watson grew up surrounded by national parks and the Great Barrier Reef. Family camping trips and up- close interactions with sea life fuelled an interest in one day becoming a marine biologist (see sidebar).
Something in the Water?
If you’ve read profiles of location analysts lately, you might have noticed a common theme. Beth Rogers of Fruit of the Loom, Ahna Miller of Driscoll’s, and Michelle Watson of Jacobs—each successful in business and data science—spent their early years dreaming of careers in marine biology.
Such a recurrence might not be enough to draw a scientific conclusion, but it does point to the diverse—and often interdisciplinary—perspectives that location analysts bring to their work.
But the clue to where her career would lead lay closer to home. Her parents ran an auto mechanic shop and instilled in Watson a strong work ethic and a client-focused view of service. Her knack for problem solving and spotting waste was apparent from an early age. Visiting her father’s workshop one day, she watched her mother and father doing inventory. Already a budding consultant, she advised them that if they bar-coded each part, they could streamline the organizational system and help ensure the right parts were on the shelf when needed. “I hate inefficiency,” she says. “I hate recreating wheels. You see how hard it is in business, that every cent counts.”
At dinner, she would play the devil’s advocate in wide-ranging conversations and arguments with her father that went on long after the table was cleared. “It used to drive my mother and sister nuts,” she laughs, but the dialogues were good practice for seeing thorny issues from multiple perspectives and finding surprising places of agreement.
She discovered a love for geography in high school, but it was as a student at James Cook University that the power of geospatial technology hit her “like a lightning bolt.” More than just a tool for creating maps, GIS identified patterns that could change how businesses attacked problems. “It’s like being an explorer,” Watson says. “You get to see new combinations of data and things that people haven’t necessarily seen.”

[On Einstein's theory of relativity:] All of a sudden, he could see it, and it just made sense. And then he spent the rest of his career trying to explain it to people. For me, geospatial has been like that my entire career. It just makes so much sense.
Michelle Watson, Jacobs
Turning Experience into Influence
As degrees in GIS were not yet available, Watson focused on environmental science—a field she believes empowers geospatial professionals in the business world by fostering a collaborative mind-set and an appreciation of the world’s interlocking ecosystems. “That concept of integrating data and understanding that one thing pulls another is just inherent to what geospatial represents.”
After graduating, she joined the consulting and engineering firm Sinclair Knight Merz—acquired by Jacobs in 2013—in an environmental science position. Over the next 20 years, she applied the lessons and insights of location intelligence and a knack for interdisciplinary thinking across the company. She worked on projects dealing with water, telecommunications, mining, defence, ports and other sectors.
That broad exposure trained her to become a highly effective communicator, able to span the work of data scientists, engineers, and planners with corporate executives who develop and sell projects.
“Michelle’s background, having spent time both in the sales side of our business and the operations side, means she really does sit on both sides of the tables and can be very effective,” says Gary Nuss, a senior vice president at Jacobs who’s worked closely with Watson. “Michelle is one of the key influencers in the organization.”

When I talk to clients, they really respond well to things visualized. And we can process visual data a lot faster than we can process things we read or hear. So being able to see the challenges of our projects visually is something that geospatial really helps us with.
Gary Nuss, Jacobs
GIS as Information Management
Jacobs’ involvement in an infrastructure recovery program in Christchurch, New Zealand, following earthquakes in 2010 and 2011 epitomized for Watson how GIS and her team of location analysts could act as strategic advisers.
Managing Physical and Digital Intersections
For more on integrating the physical world with digital design, explore these resources.
The geospatial team was originally brought in to assist the Stronger Christchurch Infrastructure Rebuild Team (SCIRT) with maps and surveys, but location analysts saw an opportunity to deliver more value. They suggested that construction crews and surveyors use mobile applications to input information; that data, combined with geotagged photos, gave planners a full picture of progress in specific locations. Moreover, before field teams even stepped outside, geospatial analysts gathered data to create hazard maps highlighting the safest routes.
“To me, it epitomizes the value of having geospatial practitioners in from day one,” Watson says.
The geospatial team’s facility with data and its strategic approach led to the creation of a forward works program. This allowed the recovery effort’s hundreds of workers to share advance notices and coordinate on rebuilding efforts, streamlining workflows and avoiding unnecessary disruptions to local businesses.
“They gained efficiencies, made their project safer, and reduced latency in information sharing,” Watson says. “It was a genuine collaboration.”
Finding the Synergies in Systems
For location intelligence to improve client outcomes, geospatial experts must step outside technical roles—and sometimes, out of comfort zones.
Finding Innovation at the Intersections
At Jacobs, Michelle Watson’s team of location analysts might perform a GIS-based climate analysis on a prospective site. Their results could show that a location slated for construction has a high risk of flooding—and should instead serve as a catch basin for water to keep other structures safe. Similarly, location analysts might discover that a site pegged for development sits on a slope greater than 7 percent—too costly for construction, but good for planting a new forest. That green upgrade can in turn raise the value of nearby properties, furnishing desirable views.
Such work exemplifies how Watson’s team uncovers innovation at the intersections.
“I’m challenging the team,” Watson says. “You need to step up and lead because often [clients and project planners] don’t know what they don’t know. It’s our job to help shape the art of the possible and bring them along.”
A recent big win for the team of location analysts came when Jacobs was selected as the Lead Masterplan Coordinators providing specialist advisory services associated with statutory planning, infrastructure, sustainability, logistics, and transport planning on the Meridian Water regeneration program in the Upper Edmonton area of North London. The Enfield Council is redeveloping 200 acres there, comprising 10,000 homes, parks, multiuse streets, and work spaces for makers. The effort is expected to generate 6,000 jobs. Project leaders want to maximize green space in an urban setting and offer a range of affordable housing options in one of the most expensive cities in the world. The Jacobs team was able to use location intelligence and a geodesign approach—harmonizing physical structures with the natural world—to meet those ambitious goals.
“From a geodesign perspective, what we’re trying to do is find the synergies between systems that provide opportunities for innovation and creative leaps forward,” says Shannon McElvaney, Jacobs’ global director of geodesign and one of the leads on the Meridian project. Jacobs won the work by pitching a data-driven, GIS-forward approach. The team’s technical prowess complemented Jacobs’ value-by-design approach, executed with the predictive analytics of location intelligence.
Contracted to provide technical design and planning advisory services for the Meridian work, the Jacobs team began by creating a digital master plan that captured building footprints and types, as well as the demand for water and electricity generated by the new construction. Next they performed a proximity analysis, clarifying how affordable, multifamily homes would sit in relation to the transit station, bike lanes, parks, and shopping in an effort to become a “15-minute city,” a neighbourhood where most needs can be met within a short walk or bike ride.
The team used GIS to track and log all incoming data, translating that into 3D models of planned sites and dashboards showing KPIs and progress against goals. Jacobs team members use the dashboards to update the Enfield Council executive team on a weekly basis. The dashboards were so well received that the client asked for new metrics to be tracked, among them social equity, air quality, and heat levels.
According to McElvaney, the project spurred Jacobs to propose a similar approach to four prospective clients, with location analysts again in the role of advisers and value generators.
“We’ve become essential to the program managers,” McElvaney says. “The planning bit of the big AEC wheel is taking us into the larger picture. If we hadn’t applied a GIS backbone to it, this would not have happened.”

For me, location intelligence has always been a business fundamental.
Michelle Watson, Jacobs
Socratic Leadership
The success of such ventures also validates Watson’s leadership approach to geospatial teams, designed to create momentum without micromanaging the result, all while improving business outcomes for Jacobs and its clients.
“We are seeing that our business is increasing because of the combination of big data, robust infrastructure, and practitioners like Michelle and her team,” Nuss says.
Always inquisitive, Watson often leads through curiosity, throwing out questions to Jacobs’ location analysts meant to get them thinking in innovative ways.
“Michelle’s superpower is that she empowers her team,” Thom says. “Her strength is that she has a vision and really pushes her team out in front of her to help them develop the capabilities and leadership that are going to expand the outcomes beyond herself.”
It’s a leadership style that aligns with Watson’s vision for the rise of location analysts: individuals who can sit at the intersections and drive innovation, using location intelligence not just to analyse data but to generate new visions of what’s possible.
This article was originally published in the global edition of WhereNext

Sharing Black Perspectives on the Racial Implications of Place
Black users of GIS share how geography provides a lens to address inequities, examine their unique perspectives, and take action.
Growing up in Philadelphia, everyone in my neighbourhood was Black. My elementary school was at the border of all-Black and all-Latinx neighbourhoods, and our school makeup reflected that. The only white people I saw in my daily life were teachers at school. I didn’t realize this was all by design until several years into my career using geographic information system (GIS) technology.
GIS helped me connect Philadelphia’s racially segregated communities to the limits to prosperity for non-white Americans. I learned that more than 200 cities across the country were redlined, yellowlined, or greenlined by a federal program that started in the 1930s, with maps guiding an effort of systemic racism. It was clear to me that GIS could be a tool for unravelling racism and designing a better future.
A Homecoming of Black GIS users provided an opportunity to gather lived experiences and share several perspectives.
Key Takeaways
- GIS empowers users to examine data and create maps that display inequities.
- Visualisations of the continuing harm of systemic racism provide a means to take action.
- Sharing lived experiences helps others empathise and consider equity to guide public policy.

I’d heard about redlining as a thing of the past, but my work in GIS for the City of Philadelphia exposed me to continuing patterns.
Clinton JohnsonSolution Architect, Esri
I’d heard about redlining as a thing of the past, but my work in GIS for the City of Philadelphia exposed me to continuing patterns. Work to support the city’s Reinvestment Fund got me excited about using GIS as a tool to uncover and eliminate racial injustices that plague my friends, family, and community. I joined Esri to expand my focus beyond a single city—and leverage my lived experience—by helping cities, counties, and organizations address racial and social inequality.
About a year and a half ago, I founded NorthStar to connect students, professionals, and entrepreneurs of African descent to collaborate to increase the representation of Black people in GIS and advocate for the use of GIS to advance equity and social justice. In the wake of the senseless and horrific killings of George Floyd, Breonna Taylor, and Ahmaud Arbery, Esri launched a Racial Equity initiative, which I lead. This work focuses on the application of GIS and mapping to address racial inequities and involves developing datasets and solutions; creating education materials in the form of demos, videos, webinars, courses, and lessons; and capturing and sharing maps and stories to elevate best practices.
At the recent virtual Esri User Conference, a Homecoming was organized by NorthStar and Blacks in GIS to provide a place for sharing perspectives. We spoke about equity, inclusivity, unity, and our power to make a difference. We captured the following personal accounts to relate what it means to be a Black GIS user:
Adrian Gardner was the longest-serving CIO at the US Federal Emergency Management Agency (FEMA) when he retired two years ago. He since founded SmarTech Nexus, a nonprofit that uses GIS, data analytics, and artificial intelligence (AI) to empower at-risk and underserved communities.
During the Homecoming, we spoke about the African continent, what’s going on there, and how people of colour in different countries have different experiences. I’ve walked through my life very differently than somebody who does not look like me.
I was born in Germany, went to high school in the US Virgin Islands and college at Tuskegee Institute, and joined the US Air Force as a second lieutenant straight out of college. I spent four years in Sicily and have done a lot of international travel for work and pleasure. I have seen and lived how people of colour are treated in different countries. Much like life in the US, it doesn’t matter how high Black individuals rises in their community or profession; they are still at risk of racial profiling in the street and the board room.
For the longest time, when I was growing up, the rest of the world wanted to model the US. Now, I see other countries showing the US how to make more equitable decisions.
Geospatial technology provides the opportunity for storytelling—setting issues in context to make them visible so that we can learn from them and then repeat what worked well.
Adrian GardnerFounder SmarTech Nexus
Some of the GIS work of the United Nations (UN) gives us an opportunity to look at, and compare, the capacity of different countries. What are those puts and takes, and how do we get all boats to rise to the same level? Geospatial technology provides the opportunity for storytelling—setting issues in context to make them visible so that we can learn from them and then repeat what worked well.
When I was at FEMA, we used GIS to understand and confirm whether dollars and support for underserved and at-risk communities was equitable. GIS provided us with the tools to look at the agency’s decision-making practices, to ensure alignment between the people requiring disaster relief and the people that received it. Often, the data speaks for itself.
GIS is central to the way our organization, SmarTech Nexus, looks at assets within a community. The technology can empower communities to participate in decisions that impact them. STN is focused on two underutilized assets that exist in every community: opportunity youth, which describes an individual between the ages of 16 and 24 who is not employed and not in school, and faith-based organizations to serve as fulfilment centres for goods and services. We are engaging young people in the practices of mapping their communities and empowering the next generation through GIS to thrive and survive in the skill-based economy. Our goal is to reduce the number of socially disconnected people in underserved communities by 500,000 over five years.
Valrie Grant calls herself a location intelligence strategist. She founded GeoTechVision, an Esri partner, and is the executive chairman of the Marlie Technology Park.
I grew up in the countryside in Jamaica where I was socialized to think that everybody is equal. When I entered the international scene and ventured to other places, I realized that was not the case elsewhere. Black Americans have a different perspective than Caribbean Blacks, probably because we are the majority in our countries, and racism isn’t as prevalent.
If you think about society as a body, every part has a different function. The hand may not be as important as the heart, but if you take any of it away, you’re just not the same. If society will recognize the value of everyone, we will be so much better for it. At the end of the day, your class or race doesn’t matter, and we all make valuable contributions. I operate like that in every sphere.
Doing things together can have an impact, which is the foundation of what geospatial technology has always been for me. It’s all about creating opportunities for ethnically diverse communities. GIS shines a light on inequities, and COVID-19 has shown that people are suffering based on where they live and the opportunities they have. It’s heartening to come together as a group to collaborate and innovate.
I think opportunities should be afforded to everyone, not just the people who were born with access.
Valrie GrantManaging Director, GeoTechVision
In 2006, I founded the Caribbean chapter of the Urban and Regional Information Systems Association (URISA). We are building on these efforts with the support of the UN-Global Geospatial Information Management (GGIM) Americas Caribbean project, which began in 2014. We now have developed a close-knit geospatial group, with some 16 Caribbean countries participating, and we are having dialogue on the international and regional level. I lead the UN- Global Geospatial Information Management (GGIM) Americas Private Sector Network. I’m also the only Caribbean representative on the World Geospatial Industry Council. You mostly see grey suits, so I’m glad to be there to represent Black women.
One of my passions is youth and education. I think opportunities should be afforded to everyone, not just the people who were born with access. With COVID-19, education has stopped in underserved communities where they don’t have access to technology—computers or the internet. We formed an initiative called EduTech Aid to provide children with tablet computers and enable access to materials so they can continue learning. We recently partnered with the Association of Caribbean States on a series of webinars on equity in education. We’re collecting data about broadband access—the location of internet deserts—and we’re mapping that to inform policy changes. We’re trying to collect as much information as possible to be able to say to the decision-makers, “This is the real picture on the ground. What are the solutions?”
Jennifer Johnson, is a senior GIS analyst, at the engineering firm HDR, a company that prides itself on inclusion and diversity that reflects the communities where it does work.
At HDR, we have a long list of team members on most projects that reflect the diverse communities we serve. Our diversity extends beyond race, age, and gender with a variety of disciplines. The inclusion and representation of different backgrounds are very important for any type of work that serves a wide variety of communities and I’m proud to have an employer that recognizes that.
The COVID-19 crisis makes us all feel so physically exhausted, mentally overwhelmed and fearful of what’s next. It’s very important to not only stay positive and hopeful for the future but to also have an understanding that the impact of this virus has been more pronounced in minority communities. The power of GIS has shown us that impact nationwide and allowed us to explore other patterns of the virus worldwide. As individuals, we can use this knowledge to be more compassionate and responsible to prevent the spread on a daily basis.
COVID-19 has also impacted the way we work. At HDR we are using GIS to provide dynamic tools that track and manage our capacity for staffing our offices responsibly. I personally work from home, but for many the office is a more productive environment. So, our GIS team collaborated with administrative staff, human resources, and office management to provide an Esri mapping solution that supports our goal to make our office a safer environment for colleagues and clients.

As an African American woman in tech and design, I feel a sense of responsibility to progress and open doors for more inclusivity.
Jennifer JohnsonSenior GIS Analyst, HDR
Growing up in Philadelphia gave me a unique perspective. What was most astonishing was realizing how maps had historically impacted those communities. Redlining is a perfect example of how a lack of inclusion (when it comes to shaping our society) can be detrimental to generations nationwide. We still see effects today when it comes to commercial investment, land ownership, and criminalization.
When I earned my position as a lead GIS analyst for the City of Philadelphia, I worked with a team to build an index of data to identify the impacts of education, drugs, crime, income, housing, accessibility and many other variables, and provide policy makers with data-driven recommendations. That team has since continued to evolve what’s now called the Stress Index, and it is a useful resource for public citizens to monitor and address important equity issues in Philadelphia.
After a few years with the CityGeo team in Philadelphia, I found myself in Nashville working as a geodesign specialist for the Metro Planning Department. This position tied in very well with my knowledge of design and my passion for 3D GIS. Moving to Nashville was a professional and cultural adjustment, but landing in the planning department meant that a big part of my job was to get to know my new city. I’ve now been in Nashville for almost four years and have found that everything I’ve learned along the way has prepared me for my current role as a senior GIS analyst at HDR.
My personal objective has always been to sustain myself doing what I love and be a positive representation of those who have similar backgrounds as me. As an African American woman in tech and design, I feel a sense of responsibility to progress and open doors for more inclusivity. Often, if you don’t see a representation of yourself in a particular career path, it can seem unattainable, so I’m hoping I can lead by example. As my career progresses, I intend to be the change I want to see in the industry by continuing to provide my unique perspective in future collaborations and uplifting other professionals who also have a passion for GIS. If we can learn from one another, we can overcome challenges more effectively as a team.
To learn how governments, nonprofits, and businesses can address racial inequity, visit Esri’s Racial Equity website. Explore deeper GIS resources for racial equity on the Racial Equity GIS Hub, including a dataset on redlining and exposure to urban heat islands.
Visualizing Patterns of Systemic Racism
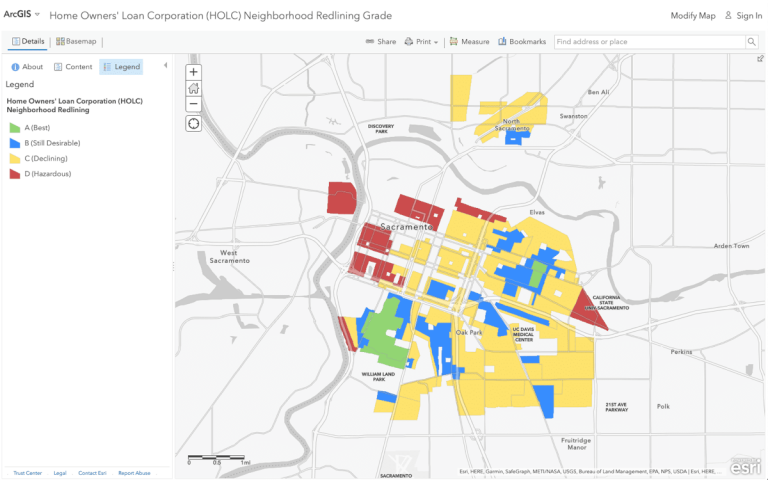
The Home Owners’ Loan Corporation (HOLC) was created in the 1930s in the US to guide investments in cities. A neighbourhood ranking system guided real estate developers and appraisers in more than 200 cities across the US. The neighbourhoods deemed hazardous were marked as red on the map. The racial bias of this action is the origin of the term redlining, which has become synonymous with government policies that underpin systemic racism.
GIS-ready historical redlining data of 143 cities is now available to help GIS users and policy makers understand how historical inequities continue today. In addition, formerly redlined neighbourhoods having fewer resources such as quality schools, access to fresh foods, and health care facilities. This historical data layer can be leveraged to advance equity and social justice in communities.
This article was originally published in the global edition of the Esri Blog
Business Risk in Focus as COVID-19, Climate Change Threaten
Companies adapting to the risks of COVID-19 are beginning to see long-term business risks through a similar lens.
Technology deployed quickly to manage a crisis often becomes integral for the long term—that may be the case with location technology when historians examine the business risks posed by COVID-19 and climate change.
The COVID-19 pandemic has proved that businesses can react effectively to even massive disruption when they harness location data. At Bass Pro Shops, a real-time dashboard delivers visibility into wide-ranging conditions across the country. That data delivers clarity on business risk and drives better, rapid decisions in a time of uncertainty.
The pandemic has heightened the need to plan for and reduce business risks, and experts now rank climate change among the most significant threats companies face. That realization has spurred what analyst firm Forrester calls a climate risk analytics market. Some corporate leaders now recognize that the location intelligence guiding them through the pandemic will also address risks tied to climate change.
Article snapshot: During the COVID-19 pandemic, business executives have used location technology to assess short-term risk and maintain operations. Now they’re adopting the same technology to face a major long-term risk—namely, climate change.
Companies Adapt to Business Risk by Examining Location
The implications of rising temperatures are being felt now in more frequent and less predictable storms, sea-level rise, and other risks. Executives who focus on long-range planning can prepare for further disruption even as they take action to reduce the pace of warming.
Around the world, coastal communities—their businesses and residents—have been forced to confront rising ocean waters due to climate change. Intense weather events in those locations and further inland have destroyed homes, businesses, roads, and bridges. In some low-lying areas, whole communities have been permanently displaced. Companies operating in those locations have faced disruptions and, alongside municipalities, are actively pursuing resilience strategies, applying location intelligence to gauge business risk and prioritize actions.
AT&T collaborated with Argonne National Laboratory to evaluate and predict the disruptions it will face for the next 30 years in the Southeastern US. This pioneering work used big data analysis and location technology to map where risks will be greatest, and the data is now available to help other companies determine their own vulnerabilities
During the COVID-19 pandemic, businesses adopted location-centric techniques to assess short-term risk. Now, executives are using the same techniques to measure and mitigate the major long-term risk of climate change.
The Risk of Relying on Diminishing Resources
Companies are also becoming more mindful of the business risk of relying on natural resources to fuel their businesses. A 2014 study in the journal Global Environmental Change pegged the annual economic value of natural resources at more than $100 trillion. Businesses that rely on natural resources for their products or services face the growing realization that supply is shrinking, and climate change may accelerate that decline.
The Coca-Cola Foundation has made a commitment to water quality and availability, driven by the fact that water is the primary ingredient in many Coca-Cola products. Companies that source ingredients from growers—such as Bunge Loders Croklaan with palm oil and Nespresso with coffee—have doubled down on sustainability, helping farmers increase yields, reduce harm to natural ecosystems, and lower the risk of depleting resources on which the businesses depend. In both cases, location intelligence, powered by a geographic information system (GIS), helps the businesses take the long view.
Similarly, energy and utility executives are grappling with the business risk of mistiming their transition to new energy sources. Economics have shifted to favour a more environment-friendly approach, since wind and solar sources are now often cheaper than fossil fuels for energy production. Several major utility and energy companies have committed to being carbon free or carbon neutral by 2050. Location intelligence will decrease investment risk by answering questions such as which locations offer the lowest development costs and the highest returns for renewable energy projects. The shift also promises to reduce another critical risk by eliminating the worry of toxic spills and litigation from environmental damage.
Recalibrating Business Risk Awareness and Preparedness
The coronavirus global pandemic is recalibrating how businesses perceive disruption. Though the threat of a pandemic was well-known, preparations fell far short of meeting the realities.
Amid pandemic-related supply chain blockages and economic turmoil, the value of geographic thinking is surging. Businesses and governments are mining troves of data about people and places, and generating location intelligence to understand the best path forward.
Real-time dashboards have become an essential tool in important discussions, as maps drive insights and targeted responses for businesses, governments, and health professionals.
Changing, and Keeping an Eye on Change
During the COVID-19 pandemic, executives have used map-based dashboards to track key indicators of business and community health. This pattern of monitoring real-time and near real-time data has now been applied to create rolling indicators about the health of the planet, providing greater awareness of collective risk.
As noted by world-renowned economist Jeffrey Sachs, shared goals and collaboration are the only way to make progress on the planet’s most pressing risks.
“We are so profoundly connected that we need the global scale, the super-regional scale, the national scale, and the local scale,” Sachs said at a recent conference, noting the location technology supporting this effort. “That is what GIS enables us to do. It is the multiscale understanding, and the ability to work across scales, that is at the core of achieving a sustainable and fair planet.”
This article was originally published in the global edition of WhereNext

Apple, Net Zero, Carbon Offsets, and Transparency
The global push to reduce carbon emissions gets a boost from Apple. Among some companies, a question of transparency lingers.
In July, Apple announced its plan to be a net zero carbon emitter by 2030, one of the most aggressive climate pledges by a big-name brand in a year packed with similar announcements.
For energy companies such as bp; transportation providers like JetBlue; and tech darlings such as Apple, Microsoft, and Amazon, the race is on to repair climate damage before repercussions reach unsustainable levels for business and society.
The growing portfolio of net zero commitments heartens many, but some see a need for closer inspection. For one, timing matters—some companies have pledged to reach their carbon goals by 2050 (the deadline for useful action, according to a UN scientific panel). Others, including Apple, Microsoft, and Unilever, say they’ll clean up a decade or more before that date.
Another important detail in the net zero movement is exactly how companies will achieve the goal, as well as what role carbon offsets will play. Some plans lean heavily on carbon offsets, which have drawn criticism for ineffectiveness.
As a push for transparency around carbon offsets grows among investors, consumers, and regulators, companies that employ them to reach net zero emissions will find an ally in smart mapping technology.
Article snapshot: Apple announces an ambitious plan to reach net zero carbon emissions by 2030, with limited reliance on carbon offsets. For companies that use offsets, a new tool for transparency emerges.
Climate Trade-Offs Raise Questions
A carbon offset is essentially a way to balance the environmental ledger. If a company’s industrial operations emit X amount of carbon into the atmosphere, it can invest in projects that will remove an equivalent amount of carbon from the air. Projects might include green power initiatives; cleaner-burning cook stoves for the developing world; or efforts to plant trees, which soak up carbon dioxide.
Sustaining Operational Awareness
Organisations that capitalize on operational awareness tend to score highly on location intelligence. Read this e-book to learn how organisations like Apple, John Deere, and the New York MTA support their missions with location intelligence.
Apple’s plan is light on carbon offsets. The company says its operations, including data centers and corporate campuses, are already net zero emitters, drawing power from renewable sources. Additionally, Apple will use its influence to encourage supply chain partners, including those who manufacture its products, to follow suit. Whatever carbon emissions cannot be avoided will be offset by renewable energy projects that Apple develops and manages.
Such limited reliance on offsets is fairly rare in the push toward a healthier climate. And perhaps because companies have created a bustling market for offsets, offset programs have a checkered past. Some have been outright scams, while others promised, for instance, a new wind farm, but cleared acres of trees to make way for it, negating the benefits.
Because of this spotty track record, today’s investors, consumers, and activists expect transparency on offsets, and smart maps often answer that call.
Keeping Carbon Offsets Honest
Whether carbon offsets are under a company’s control, as in Apple’s case, or purchased through third parties, it will be critical to monitor and communicate progress. These projects take place around the world, often in remote locations, and keeping track of them demands diligence and scalable technology.
Felix Finkbeiner understands the importance of monitoring offset work; he leads a global force of nearly 90,000 people who deliver such projects in more than 70 countries. As founder of Plant for the Planet, a nonprofit dedicated to planting one trillion trees, Finkbeiner and team help companies achieve net zero goals.
Plant for the Planet uses smart maps to identify companies that invest in its work. Using an app built on a geographic information system (GIS), the team also provides key details. “For each project,” Finkbeiner told an audience in 2018, “you can see where they plant, you can see pictures and videos of the project and also the survival rate of the trees planted and the cost per tree.
On the other side of the exchange, companies that fund offsetting work can include smart maps on sustainability websites or in CSR reports, providing transparency into the projects they subsidise and the impacts they achieve.
That kind of monitoring and communication has roots in the sustainable sourcing movement—a practice of increasing importance to consumer goods companies. Nespresso, for instance, uses smart maps to provide consumers a view into where and how coffee crops are grown. Using GIS technology to blend maps and storytelling, the company incorporates data and human interest into its presentations, much as another organisation might tell the story of carbon offset projects around the world.
As corporate executives formalize plans to join Apple and other industry leaders in the quest for net zero status, they’ll find that reliable monitoring, strong partnerships, and smart maps go a long way toward communicating the results customers and investors demand.
This article was originally published in the global edition of WhereNext

A Breakthrough Way to Map DNA?
Alice Rathjen has spent a career contemplating new ways to study human genetic information. Now she has a plan.
Alice Rathjen has a modest proposal: a new method of studying and sharing genetic information that could accelerate our understanding of COVID-19 and other health threats.
Rathjen is integrating the worlds of DNA research and mapping technology. Her approach is intuitive yet novel, and she may be the first person in the world to actively pursue it.
In 2006, Rathjen was granted a seminal patent for mapping the genome in 2D and 3D, establishing her as one of the pioneers in the field of computational biology. However, computational biology software soon became the purview of universities, and while Rathjen pursued her entrepreneurial career, she remained something of an academic outsider. The innovation she shares here may be a byproduct of that duality—the insider who understands the field’s limitations and the outsider who sees unexpected ways to overcome them. She has launched a company—DNA Compass—to use the digital mapping technology GIS (geographic information systems) in a way that could disrupt the practice of genetics.
WhereNext spoke with Rathjen to learn about this paradigm shift, the hurdles it faces, and why she thinks a new model of mapping could help researchers develop COVID-19 treatments more quickly.
A brief genetics refresher: Each strand of DNA is composed of base pairs, which come in two varieties—guanine pairs with cytosine, adenine pairs with thymine. A strand of DNA makes up a gene. A strand of genes makes up a chromosome, and chromosomes make up the human genome. Each of the 23 human chromosomes is a different length. Chromosome one, for instance, is the longest, comprising 249 million base pairs.
Article snapshot: During the COVID-19 pandemic, scientists have had limited access to the DNA that will help them understand who is vulnerable to the disease. Alice Rathjen wants to change that, and she may just be the first in the world to offer this particular solution.
A Worldwide Health Challenge
WhereNext: You’ve designed a groundbreaking way to map human DNA. Before we explore that, I want to understand what motivated your work. Why did you want to change the way people study and share genetic information?
Alice Rathjen: Mainly to speed up health outcomes. When we face a global health risk like COVID-19, researchers need to collaborate quickly to understand the disease and people’s genetic vulnerability to it. And they need to do that on a global scale, which means they need simple tools to collaborate across borders.
WhereNext: And that’s not happening with COVID-19 research?
Rathjen: It’s happening, but not at the speed and scale it could. Researchers in the US and Europe are working hard to understand genetic risk markers for COVID-19, but their data is very limited. At last check, there were only 18 entities worldwide that were willing to and capable of uploading COVID-19 patient genomes to US or EU servers for analysis. So this critical global initiative has fewer than 6,500 COVID-19 patient genomes to analyse—out of more than 20 million COVID-19 cases worldwide.
WhereNext: And the innovation you’re working on is meant to make it easier to share and analyse that data?
Rathjen: Yes. I want to turn patient genetic information into a kind of location data. That way, researchers could use existing GIS technology—instead of unweildy text files and pivot tables—to visualise risk factors. The GIS method would also help them exchange genetic data. Countries could keep their patient information, but give outside researchers permission to examine it.
Identifying COVID-19 Risk through Data
WhereNext: Let’s talk about how researchers look for disease risk factors in DNA.
Rathjen: With COVID-19, genetic scientists have identified about 700 locations on human chromosomes that they think are associated with different levels of disease severity. The trick is they need a lot more genomes to confirm that. The more genomes they have, the quicker they can find out what is statistically significant and pinpoint which locations are important for drugs or vaccine targets.
WhereNext: You envision using GIS technology to address this, which would be a significant shift. Can you explain that?
Rathjen: Where technology comes in critically is that with GIS, you can publish genomes as web services [data shareable via the internet], so that entities can make their genetic data accessible to each other without sending it across borders.
With GIS, you have enough controls in the software that researchers can set up role-based access. They can determine what raw data is shared and which annotations different users can add to genes. [GIS has] a collaboration layer that bioinformatics tools don’t have.
A New Way of Mapping DNA
WhereNext: So one of your goals is to make genetic information about COVID-19 and other health threats more sharable. The other is to make it easier for researchers to visualise genes. And to do that, you used GIS technology to map genes. Can you explain that?
Rathjen: All we did was pretty simple. We just created a micro-geocoding service.
WhereNext: That sounds like a new kind of location intelligence. Are you talking about creating addresses inside the human body? Why is that important?
Rathjen: I treated the cell as the area I was trying to map, because researchers organise genetic data by location. They [say] “On this chromosome, at this position, the person has an A, a T, a C, or a G.” Then they compare that with a reference genome, and where the person varies, [researchers note] a unique identifier for that location: “At this chromosome, at this position, there’s normally an A, and people that are sick have a T, and here’s what we think it means.” That’s how all genetic data worldwide is structured now. It’s location data. When you see all those identifiers mapped on one screen using GIS [see image below], you quickly understand a person’s genetic risk profile for COVID-19 and other diseases.
Finding COVID-19 Risk Locations
WhereNext: What are researchers doing to identify risk mutations for COVID-19?
Rathjen: As part of the COVID-19 Host Genetics Initiative, researchers are examining the genetic information of people who have died of COVID-19. As I mentioned, their work has been limited so far by the small number of genomes that are available to research.
But they have begun to identify certain genetic markers that may be associated with the severity of a patient’s response to COVID-19—locations that have to do with blood type, diabetes, obesity, immune response, and more. Researchers don’t understand what the mutation is doing that’s causing the higher risk, but they do have an early dataset showing those possible risk markers.
WhereNext: And why is it important to map those locations?
Rathjen: With COVID, we’re going to have vaccines and treatments soon, and there’s going to be a need to prioritise patient populations for treatment based on genomic risk. This is critical, life-saving information that needs to be rapidly distributed, but from authoritative channels in a controlled manner around the globe, by every entity based on their own priorities, their own ethics standards.

Researchers could compare COVID-19 risk markers against a patient’s genome and look for people that are high risk and prioritise them for vaccines, treatments, or isolation.
Alice Rathjen, DNA Compass
A New Address Service for DNA
WhereNext: That brings us back to your idea of creating a GIS address service, or micro-geocoding service. GIS technology has been used for decades to show where things are in the world, since everything has an X and Y coordinate. How did you apply that kind of mapping to mapping risk markers in our cells?
Rathjen: The trick was to create a coordinate system that would work for the genome. And I cut a corner here by adjusting the map of the world.
WhereNext: How so?
Rathjen: One DNA base pair is equal to 10 centimetres on the earth.
WhereNext: Okay. How did that help?

With GIS technology, researchers see maps of likely COVID-19 risk factors. This simple, consolidated view of each patient’s genetic profile is an alternative to existing tools—many of which display one chromosome at a time.
Rathjen: I did that because chromosome one is about 249 million units [base pairs] from the start to the end, and to get it to fit inside the coordinate system that we use for the earth, I had to divide the position on a chromosome by 10, and then I moved it 100 million units to the west. And lo and behold, now if I start chromosome one around Alaska, it fits inside the map of the Earth.
WhereNext: And that’s how you created the micro geocoding service you mentioned?
Rathjen: Right. If you think of the [GIS] geocoding services, it takes an address—in this case, the position of a base pair on a chromosome—and creates an XY coordinate for it. If we make that modification, then all the GIS mapping software that’s up and running around the earth can be used to analyse genomes.
WhereNext: Have you already applied this mapping to COVID-19 data?
Rathjen: Yes. We’ve taken the possible risk markers that researchers have identified for COVID-19 and mapped them in GIS.
(The image above shows what this genetic map looks like.)
A Roadmap for a New Genetic Map
WhereNext: Do you see other ways location technology might be used in genetic analysis?
Rathjen: I’ve been watching how GIS technology, AI, and aerial imagery have evolved to help us understand what’s happening on earth. [Applications range from wildfires to business opportunities.] In the genetics field, microscopes are getting more powerful than ever. We’re starting to see detailed photos of cells with elevation data and papers on the spatial analysis of genomes. The fields of bioinformatics and mapping software seem to be converging.
WhereNext: What comes next for your approach to genetic mapping?
Rathjen: We’ve tested our technique and believe it can help researchers worldwide. Since it’s a new approach, it would need to be validated by an agency like the FDA or the CDC before it can be used as a product.
WhereNext: Why are you optimistic about this approach?
Rathjen: I think the bioinformatics community is looking for a federated solution where data can stay in its country of origin and still help scientists address COVID-19 and other diseases. And the simplicity of visualising genetic markers through mapping technology really intrigues me.
I feel like we could be on the verge of a new approach to disease and genetic research—and that we could support the work of scientists who are improving human health. That’s what I’m excited about.
This article was originally published in the global edition of WhereNext

University of Exeter Expands GIS Accessibility and Learning across Campus
Location intelligence makes an outsized impact during this time of crisis, and it is poised for another wave of innovation and adoption.
Advances in access and functionality are changing the way students use geographic information system (GIS) technology to learn at the University of Exeter in the United Kingdom.
Dr. Damien Mansell, senior lecturer of physical geography at the University of Exeter, has helped lead the evolution by establishing the Geography with Applied GIS program.
The centrepiece of this effort is the university's GIS mapping and analytics platform, which is available to all students on campus through the university's new single sign-on (SSO) integration. SSO enables users to quickly and securely authenticate their permissions and instantly gain unfettered access to the university's ArcGIS without having to create and manage additional logins.
Mansell's advocacy for geospatial learning and the advantage of SSO have resulted in over 1,360 students, academics, and researchers using ArcGIS. Beyond the application for the geography field, they are using GIS for their work in diverse areas of study such as archaeology, engineering, biosciences, renewable energy, and geology and mining.
A New, Applied Approach to Learning
In 2014, Mansell redesigned a spatial skills course that he was to begin teaching, transforming it into an applied GIS and remote sensing course. It was the first course on campus to provide an introduction to GIS as a discipline, wherein students could learn the geospatial skills necessary to apply to geographic research.
After attending the 2014 Esri User Conference, he returned to campus with a deeper understanding of what ArcGIS Online could provide his program's students. They were introduced to a new spatial analysis workflow, discovering how they could capture primary data with the ArcGIS Collector mobile app in the field, upload and analyse that data in ArcGIS Online, and showcase it with ArcGIS StoryMaps. Previously, students were presenting their data in reports, using static map figures and writing figure captions, similar to a scientific paper. Now, with the evolution of interactive maps in their toolkit, students can build a powerful narrative by visualizing their compelling story.
Teaching GIS within the Context of Physical Geography
Mansell's Geography with Applied GIS program at the University of Exeter is the first of its kind in the United Kingdom. The new, applied approach to GIS being taught in Mansell's classroom is making an impact on students, with a hands-on learning model.
"Rather than saying this is a GIS module today, we're going to learn about polygons or geocoding or whatever it might be, we're actually studying it all in context of a research problem or question," said Mansell.
One such example involved his students examining local fluvial geomorphology, interactions between the physical shapes of rivers, their water and sediment transport processes, and the landforms they create.
"And so everything was focused on the inquiry . . . how they can build that understanding of something—fluvial geomorphology—something they've learned at school, but obviously to research it, measure and understand it using spatial analysis. So they're learning GIS through answering a research question," said Mansell.
Mansell is interested in using the geospatial approach for non-traditional GIS courses at the university—showing students how to utilize GIS to answer questions beyond geography.
"So the current situation we have is that students come to us, enroll in geography. They start learning geography through exploring it in GIS. They get hooked on the tools, and then half of the physical geography students are transferring into Geography with Applied GIS and graduating as GIS students," said Mansell.

GPS points updating the current channel position are shown in green, sites or transects and other points of observation are in purple and yellow respectively. Field photos are presented as interactive pop-ups, geotagged to the GPS point using Esri’s collector app. In this photo pop up students are measuring transects or relic fluvial channels using a surveyor’s level.
Streamlining Access to GIS across Campus
One of the major developments widening the adoption of GIS at the University of Exeter was the integration of SSO functionality, which linked ArcGIS with the university's information technology (IT) system.
The ease of use SSO provides has made GIS accessible from anywhere on campus, to serve any student, professor, or researcher, regardless of discipline or subject area. Prior to implementation, the university was using a manual process that required the review and approval of each individual's request for access to ArcGIS.
The new login system has significantly reduced the administrative workload required to manage users across multiple ArcGIS organisational accounts, allowing IT staff to focus more of their time on tackling important issues that are of higher priority.
Applied GIS Learning Gains Wide Interest
While the implementation of SSO has directly contributed to the increase in adoption of GIS by students outside geography, it is Mansell's efforts to promote the technology's wide-ranging capabilities that have made a lasting impact.
More and more students not enrolled in core geography courses are asking to use the GIS tools that the program has made available. They are interested in using ArcGIS StoryMaps to present their findings in a visually appealing way.
As a result, ArcGIS StoryMaps is being offered as an assessment support tool in courses that do not include GIS training. Students outside GIS modules are leveraging their new geospatial skills to demonstrate their learning of subject-based knowledge in the discipline.
The popularity of the program has surpassed all expectations, as more and more students are discovering GIS, developing interest, and transferring into it. The new approach to learning spatial analysis, established by Mansell, is making it relevant to their coursework, both inside and outside the program.
"The feedback I was getting from graduates who went into GIS careers was that they were coming out of the program with skills which surpassed most of their fellow geography graduates from other universities," said Mansell.

Spyglass feature tool allowing the user to interactively visualise the changes from Esri’s imagery basemap and a georectified historic map from 1890. In this screenshot of student work the spyglass highlights an area of channel stability. Here the river has maintained its course, flowing under a bridge so is due to anthropogenic influence on the flood plain

Digitised channel polygons provide an overview of channel migration and stability. Here the student has selected a sequential colour scheme and layer ordering with the most recent image presented last and in a lighter shade. The oldest channel polygon is darkest, digitised form a 1980 historic map.
Studying in the University of Exeter's new Geography with Applied GIS program has been an invaluable experience for transitioning into a GIS-based career. Learning how to utilize GIS in various landscape management applications taught by expert lecturers in the field has provided me with not only the sought-after technical skills to analyse geospatial data but also a great passion for remote sensing and the environment.
_________
Rebecca Marsden
Graduate of the Geography with Applied GIS program, University of Exeter
Addy Pope – Esri UK
Addy is the Higher Education Customer Success Manager for Esri UK. In this role, he helps universities across the UK and Ireland to use ArcGIS to enhance teaching & learning and to enable research. Addy has over 20 years’ experience in the GIS sector working in research and consulting roles before moving into education service provision with Edina at the University of Edinburgh prior to joining Esri.

Let’s go back to the future
Drawing on lessons learned during the COVID-19 lockdown, Esri UK is adopting more flexible, customer-focused and sustainable ways of working for the future.
Drawing on lessons learned during the COVID-19 lockdown, Esri UK is adopting more flexible, customer-focused and sustainable ways of working for the future.
By Peter Wilkinson, Esri UK
After months of unprecedented disruption to our lives and businesses, lockdown is now beginning to ease in parts of the UK. Whether we are keenly anticipating the reopening of pubs and hairdressers, planning visits to family, or desperate to dispatch our kids back to school, we are all, one way or another, looking forward to getting back to some sort of normality.
At Esri UK, we are becoming increasingly aware that, as an organisation, we should not simply be aiming to go back to how things were before. Rather, we should be planning to go back to how things could have been before and adopting better ways of delivering services for our customers. Being forced into an unfamiliar situation where we all had to work from home, may have been unsettling at first, but it showed us that we could work remotely and that this approach to delivering services could have long term benefits for our employees, our customers and our planet.
With this is mind, Esri UK is developing a new ‘Remote-First’ approach to delivering Professional Services. We aim to take the lessons learnt over the last three months and introduce new ways of working that deliver value for our customers, our employees and our planet. And whilst there will still be plenty of occasions for face-to-face contact, we are finding a more flexible approach is helping both Esri UK and our customers to improve their ways of working, so that we can all realise benefits in the aftermath of COVID-19.
Becoming more responsive to customer needs
Our experience over recent months has shown us that we can continue to deliver Professional Services while working remotely and, at the same time, be more responsive to our customers’ requirements. Travel arrangements are now much simplified and our consultants can be available at shorter notice to work on a wider range of customer projects. For example, they can work on projects in Aberdeen one day and Plymouth the next, without the usual logistical challenges. We can also put together multi-skilled teams more easily and engage our experts in multiple projects in a far more flexible way than before. During the lockdown, Esri UK successfully delivered a wide range of exciting new projects for customers. The vast majority of these were originally planned as on-site customer engagements, but were delivered remotely using a wide range of collaborative tools.
Looking ahead, a Remote-First approach will open up options for Esri UK to introduce more flexible consultancy packages, for example giving customers the ability to draw on short bursts of our support when they need it, without having to wait until they ‘build up’ sufficient need to warrant a full day’s worth of consultancy. Like our on-site services, our remote consultancy services, will help our customers to innovate, improve their efficiency and deliver new services so that they can grow profitably and succeed in the wake of the COVID-19 crisis.
During the lockdown, Esri UK successfully delivered a wide range of projects for our customers. The vast majority of these were originally planned as on-site customer engagements, but were ultimately delivered remotely using a range of collaborative tools. For example, at Transport for West Midlands (TfWM) we were one week into their new Customer Advantage Programme when lockdown began. Our working location changed overnight, but we were able to respond by introducing new communication channels from the start, including video calls and instant messaging and ‘virtually’ joining the regular team meetings. Lockdown also changed priorities with a new focus on using ArcGIS Hub to provide information to keep vital services running for healthcare staff and other key workers. We were able to respond quickly and provide additional support whilst continuing to work collaboratively as a team. As the COVID situation evolved, we supported a range of other activities including a successful bid to the Emergency Active Travel Fund to support walking and cycling in the West Midlands.
“ESRI have continued to provide a superb service, despite the changing circumstances. It has been like having an extension of our existing team and I believe we have actually received greater output as a result of the more flexible working and a reduction in travel time” – Stuart Lester, Data Innovation Lead, Transport for West Midlands.
Enabling flexible working for employees
When the lockdown first came into effect, home working was a necessity not a choice, but over time many people have discovered that they enjoy the freedom from commuting, the peace and quiet of a home office and the potential of more flexible working hours. One recent survey, commissioned by Skillcast and conducted by YouGov (May 2020), suggested 68% of people who experienced home working for the first time during lockdown said they would like to carry on working from home after the COVID-19 crisis. 70% believed they could be as productive when working from home as in the office.
Where possible, Esri UK plans to give its Professional Services team the flexibility to be able to work remotely in the future. Lockdown has shown us that we already have all the technology we need to enable our employees to work effectively from home. At the height of the crisis, we were able to continue to deliver solutions for the vast majority of our customers with minimal disruption using a suite of collaboration tools from video calling, online chat and desktop sharing applications to project management, virtual whiteboarding and code sharing platforms. These tools ensured that our customers remained involved and were able to contribute throughout the entire journey. If necessary, consultants could also access customers’ ArcGIS environments in a secure way and implement GIS solutions directly into cloud platforms such as Azure and Amazon Web Services (AWS).
In the post-COVID-19 era, we anticipate that we will be working with a growing number of our customers to help them migrate their ArcGIS platforms to the cloud, so that they can also make it easier for their own employees to work remotely and work from home. The Environment Agency is one example of an organisation that had already migrated its on-premises ArcGIS platform to a cloud-based, managed service prior to the outbreak of COVID-19. As a result, all of the organisation’s 10,000 employees had access to vital flood and environmental data, from home and the field, enabling them to work productively throughout and beyond the lockdown.

Environment Agency employees can access ArcGIS from home and the field, Image ©Environment Agency
Supporting sustainable working practices
Two things that our customers care about increasingly are our ethical and sustainability credentials. More and more of our customers are implementing significant Corporate Social Responsibility programmes that are affecting real organisational change. At Esri UK we are taking a similar approach, and we also want to support our customers’ aspirations. Through our new Remote-First approach to delivering Professional Services, we can reduce our travel, cut our carbon footprint and help our customers to achieve more sustainable supply chains.
We are inspired in particular by the leadership shown by the global insurance company RSA, which has been an Esri UK customer for around 20 years. “How we do business is as important as what we do, and our customers, colleagues and partners rightly ask that we are conscious of this,” writes Stephen Hester, Group Chief Executive of RSA Insurance, in the forward to the organisation’s 2019 Corporate Responsibility Report. As part of RSA’s Confident Futures strategy, the organisation is building social and environmental criteria into its processes for selecting and managing suppliers and, in 2019, it assessed 80% of its suppliers against a range of environmental, social and corporate governance issues. We know that many organisations are taking a similar ethical approach to sourcing products and selecting service providers - and others will follow their lead. In our opinion, remote service delivery is one example of the right ethical thing to do, when travel isn’t absolutely necessary.
That said, we will not stop delivering on-site Professional Services all together. There will still be times when consultants will be able to deliver best value when working physically within a building and alongside an in-house team. However, we do plan to reset the balance between on-site and remote working. COVID-19 has shown us that we can deliver the same high quality consultancy and technical services from our homes that we do in our customers’ offices, while improving the health and wellbeing of our staff and reducing our carbon footprint. At the same time, many of our customers are learning that they can likewise use ArcGIS in the cloud to improve their employee wellbeing and corporate sustainability. So let’s no longer go back to the way things were before - let’s go back to the future instead.
 Peter Wilkinson - Esri UK
Peter Wilkinson is Head of Professional Services at Esri UK. In this role, he leads a team of over 100 consultants, developers, architects and project managers who deliver projects to a wide range of customers across multiple sectors. Projects range from one or two days of advice and guidance, to significant programmes of work which run for many years. Pete has been with Esri UK for 20 years having started as a GIS consultant. He has worked in various parts of the business including Presales, Training and Support.
An Awakening: Location Intelligence Receives the Spotlight It Deserves
Location intelligence makes an outsized impact during this time of crisis, and it is poised for another wave of innovation and adoption.
Location intelligence makes an outsized impact during this time of crisis, and it is poised for another wave of innovation and adoption.
Key Takeaways
- The UK government looks to geospatial technology to power economic recovery and growth.
- GIS has proven its worth during this time of global COVID-19 crisis.
- Now is a golden age of location intelligence that provides clarity and improves outcomes.
The UK just released a geospatial strategy report acknowledging that location data and technology make everyday lives easier. It also catalogues a great deal more potential to boost economic, social, and environmental outcomes. The document puts great weight on location intelligence to “unite and level up the country by connecting people, organisations and services.”
That quote quickly sums the importance and power of location data and geographic information system (GIS) technology to make sense of place. It also puts faith in location intelligence to guide us out of crises—including the current global pandemic and the growing specter of climate change—and to improve the economy while working to better understand ourselves.
The UK, like most countries, uses location intelligence at all levels of government to help manage all that they do. The tools underpin effective policy by quantifying constituents and monitoring the equitable distribution of resources. Infrastructure projects run on a foundation of geospatial technology, including detailed digital twins that bring a new level of efficiency to the architecture, engineering and construction industry. Disaster and pandemic responses are guided by geospatial communication from the top of the world’s largest health organizations all the way down to the boots on the ground of our first responders. Businesses rely on location intelligence to improve operations and guide strategy, and today’s uncertainties make the tools even more integral by providing a means to monitor and analyse much-changed geographies and guide strategies for reopening.
The UK believes geospatial tools and the industry can help drive the UK’s future economic recovery and growth. As a long-standing innovator in all things geospatial, the world is listening. The country’s mapmaker, Ordnance Survey, epitomizes what’s possible by leading the world in a transformation powered by automation. If the UK asserts that the time is right to unlock more potential in the geospatial industry, it’s a declaration that marks a sounding shot for a race of continued geospatial innovation.
Making Sense in an Unprecedented Crisis
The global COVID-19 pandemic provides yet a new level of validation about the importance of location intelligence. Immediately, the value of a map-based visualization showed the dimensions of the crisis, with the Johns Hopkins University dashboard continually showing how the virus is spreading. Every day billions of people turn to this map-based dashboard to understand trends, epicenters, spread, proximity, vulnerability, and more

The pandemic has helped the world gain a new appreciation about the importance of geography and the value of a map for powerful communication. From the early days of the outbreak, the dashboard told the world that the virus was something new and deadly. While we all watched it spread, a map helped us all prepare, and it crystallized how the world has become so interconnected.
During this crisis, GIS users have applied their knowledge and creativity to respond and support their organizations and communities. Communities, states, and whole nations have used GIS to model forecasts and compare them against hospital capacity, to add more hospital beds where needed. We have also seen the effectiveness of ongoing geospatial monitoring to gauge the benefits of social distancing as the key intervention to avoid worst-case scenarios of spread and impacts.
Worldwide, GIS users have rallied to map the supply chain of personal protective equipment, understand the locations of our most vulnerable populations, collect food resources and convey where those most vulnerable and disrupted can get food, target new locations for testing and care facilities, and rally around essential workers and businesses.
Location intelligence has been central to the response–and will be key in the recovery.
The Geospatial Revolution
Today, GIS is being applied to so many domains in the commercial, nonprofit and government sectors, spanning capabilities from quick data capture to monitoring operations and guiding strategy. The key functions of the toolset remain rooted in mapmaking and spatial analytics, but leaps in flexibility and ease of use have enabled whole new workflows. The flow of location information has never been more fluid.

Esri appreciates the uniqueness of this moment. Past crises have spotlighted the importance of the tools, but today’s geospatial technology has reached a much wider audience. New patterns have emerged to collect data from a distributed workforce and quickly share to provide situational awareness. Enterprises are creating new levels of linkages, using shared understanding to bring teams closer even as we social distance.
GIS is central in every Emergency Operation Center in governments and businesses, which are operating around the clock and around the world. Now as things reopen, GIS is used to understand impacts on individuals and organizations. GIS-based surveys assess all manner of disruptions and the intelligence gathered is being used to shore up vulnerable businesses and communities. With inequity top of mind, the tools are fundamental to an examination of fairness.
Growing Commercial Awareness
Advancements in data gathering, data science, and business intelligence have helped fuel the creation of the location intelligence market as a distinct subsector of the geospatial industry. This newer offshoot provides unique abilities to understand people and place. Businesses apply location intelligence to discern the proclivities of customers and to get an edge by improving the efficiency of operations.
Forrester Research is famed for its analysis of the impacts of technology on business. The firm was prescient when it made the bold call in 2011 that we’re entering a new age of the customer, with technology empowering consumers to demand more from businesses. Forrester just released a report “The Forrester Wave™: Location Intelligence Platforms, Q2 2020” that digs deeply into the players and practices used to derive customer insight. The report exclaims that now is the golden age of location intelligence.

Businesses use location intelligence to tailor and optimize the customer experience and to guide strategy and actions. The modern GIS platform’s ability to support different user types helps adapt the tool to fit many business functions. This feeds data from the whole of operations, marketing and other divisions to provide a more holistic corporate understanding. Given the pressures businesses currently face, location intelligence is more important than ever, and the tools are up to the task.
According to a blog post by James McCormick of Forrester, the evolution of location intelligence provides a key capability to bring about digital transformation. Esri echoes the feeling that the time is ripe and is proud to be named by Forrester as a leader among location intelligence platform providers.
The geospatial mindset spans science, technology, business, and governance. The new flexibility of the tools and data make cross-sector integration possible, and new levels of collaboration have emerged. During this era of increased corporate social responsibility, accelerated socio-environmental change around the world, and the need to remain vigilant during this crisis, location intelligence unites stakeholders around common causes.
As we navigate and rebound from the COVID-19 pandemic, location intelligence will help guide data-driven decisions that make sense of every place and include a greater knowledge of who we are.
Learn more about the new Forrester report and the power and value of location intelligence.
This article originally appeared on the Esri Blog

When Business as Usual is Essential but Impossible
How the UK’s utilities are reinventing the way they work to enable them to sustain critical water and energy services.
How the UK’s utilities are reinventing the way they work to enable them to sustain critical water and energy services.
Realisation is beginning to dawn that business as usual may not be possible again for quite some time. The challenges for all businesses during and following the COVID-19 pandemic are huge, but, for the utilities sector in particular, they are immense.
Water, gas and electricity organisations need to continue to deliver reliable services for all UK households and business premises, not to mention the thousands of hospitals, care homes and other front line services that depend on energy and water to care for the sick and save lives. Yet their day-to-day operations are impeded by limited access to homes and businesses, a depleted workforce and new social distancing rules. Business as usual is absolutely essential, but impossible – so new ways of working will have to be found.
Throughout the utilities sector, many organisations are successfully addressing the challenges that have arisen from the COVID-19 crisis and are maintaining their vital operations by innovating with geospatial information system (GIS) technology. Taking advantage of GIS dashboards, web apps and mobile solutions, utilities are reinventing business processes to make them more mobile, more efficient or more accessible to large numbers of employees. They are also adapting the way they work to accommodate social distancing and prioritise services for vulnerable customers.
Enterprising utilities are using GIS to:
Empower a home-based workforce
With just a few days’ notice, utility organisations needed to move vast numbers of office-based employees from offices and depots and give them the tools they needed to work from home. Solutions like Esri’s ArcGIS Online allow organisations to make data and core services available to employees via the Internet and enable them to rapidly deliver tactical cloud-based GIS solutions to help them sustain their core operations during the evolving COVID-19 outbreak.
Expand opportunities for mobile working
During COVID-19 Severn Trent Water has equipped its employees with rapidly-configured mobile GIS tools for capturing, checking and updating asset information. In this new agile way, the organisation has been able to make best use of the eyes and ears of employees while they are out on their daily exercise in their local communities to improve the health of its asset data and report issues. For example, employees can report leaks or asset concerns that teams can then respond to quickly enabling them to improve their services for customers and operate more cost effectively.
Understand risk and plan accordingly
As a pandemic of this type is unprecedented in our lifetime, utilities have needed to quickly gain a detailed understanding of the risks. A number of utilities have created ArcGIS dashboards to track the spread of virus hot spots using data from Public Health England, as well as analysing data from the Office for National Statistics about the locations of vulnerable people. With this insight, they have identified locations where there were high proportions of recorded cases, which ultimately directed the planning and scheduling of maintenance services to protect employees and deliver the best possible services for customers.
Support vulnerable customers
If an emergency were to occur during lockdown, such as a power cut or water outage, utilities would have a responsibility to provide priority support to vulnerable groups and healthcare providers, such as hospitals. Scottish Water has created a versatile app that enables its control room staff to quickly identify all the vulnerable households, hospitals, care homes, prisons and other vulnerable groups affected by an unplanned water outage in minutes rather than an hour. This ArcGIS web app accelerates the organisation’s emergency planning, enabling it to deliver bottled water or tanks of water to vulnerable groups much more quickly in the event of an incident. It now has the ability to deliver a faster response to priority customers not only during the pandemic but any time an incident occurs, any time in the future.
Operate with social distancing
Social distancing guidelines are forcing utilities to completely reorganise the way that jobs are planned and carried out. At the simplest level, two engineers can no longer travel together in the same van or work in close proximity in the same substation, but it is much more complicated than this. Using ArcGIS, utilities can view planned maintenance jobs in a geospatial context and over time to identify the best way to allocate employees, vehicles and resources to ensure that essential works can be completed in a safe way.
Limit the spread of the virus
Current scientific advice indicates that the COVID-19 virus can survive on some surfaces for over 24 hours. Consequently, some utilities are now considering using ArcGIS to help them plan work schedules to minimise the number of people who actually need to touch certain assets, within a specific period of time. ArcGIS can be used to help establish working teams that do not interact, do not visit the same substations or do not touch the same fuse boxes within a 72-hour period to minimise the risk of large numbers of employees having to self-isolate if a colleague contracts the virus.
In many ways, the utility sector is shining a light on the way forwards for other industry sectors. Using ArcGIS, it is rapidly introducing new, more efficient, socially-distanced ways of working and focusing on the needs of the most vulnerable in society. Most importantly, utilities are successfully overcoming challenges to continue to deliver the services that we all depend on. Within just a few weeks, they have clearly demonstrated that when business as usual is essential, business as usual evolves.
 Craig Hayes - Esri UK
Craig Hayes is Head of Practice for Critical Infrastructure at Esri UK. In this role,he advises the UK’s water, electricity and gas utilities, telecommunications companies and transport organisations about how to optimise the use of GIS.
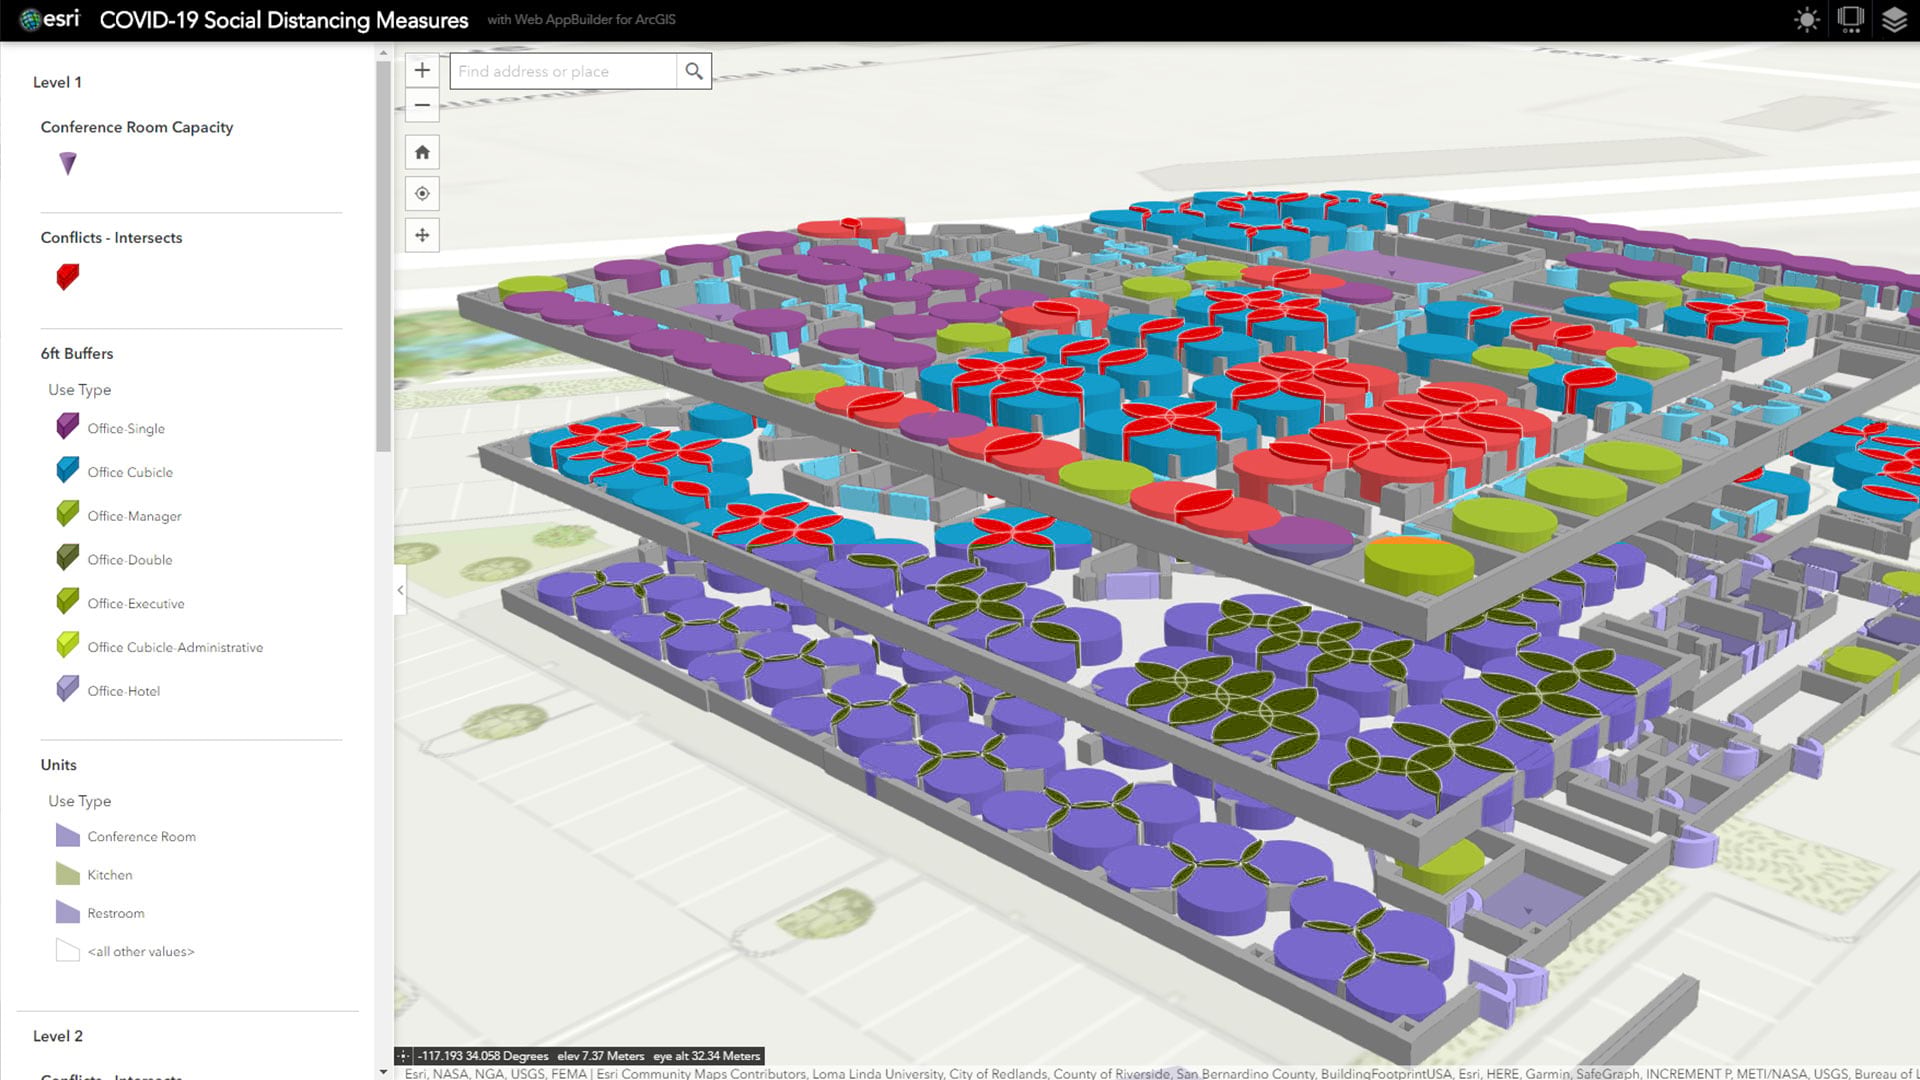
Think Tank: How to Reopen the Workplace during COVID-19
Faced with an unprecedented threat to employee safety, business and organisational leaders are mapping a changed workplace.
As the COVID-19 pandemic impacts the rules of human interaction, business and organisational leaders must establish a new definition of workplace safety for their facilities.
In this Think Tank, Esri’s Brian Cross talks to indoor mapping experts Will Isley and Beau Ryck about the conversations they’re having with business leaders, what it means to establish a common operating picture of an organisation's facilities, and how to create a new level of safety in the workplace. Esri’s Pat Wallis provides additional context throughout the interview.
Brian Cross: We’ve explored the trend of indoor mapping in the past, and that topic is quickly gaining attention as business leaders contemplate new patterns of work and challenges to safety and health in the workplace.
To put this in perspective, I thought we could start by discussing what workplace challenges executives were solving with indoor maps before COVID-19?
Beau Ryck: The main challenge has been developing a system of record that organises building and floorplan data. Employers use this to improve workplace experiences for employees and visitors—through wayfinding and room-booking applications, for example. They also use the data to manage maintenance more efficiently. Indoor maps create a common operating picture that allows them to manage buildings and equipment as assets.
Cross: Now you’re both helping companies address new priorities as they respond to COVID-19. We’ll explore those in a minute, but I’m curious whether you see this pandemic having long-term effects on the workplace?
Will Isley: I think COVID-19 will change the workplace in lasting ways—similar to the way September 11 changed security practices in the airline industry. Safety has always been a basic premise of the workplace, but you might say it lived in the background. Now it’s at the top of every executive’s agenda, and will be for the foreseeable future. Companies have to protect their employees, because if workers aren’t safe, operations can’t continue.
Ryck: I agree. Safety challenges in the workplace won’t go away once the COVID-19 threat fades. Natural and human-made disasters will continue to occur, and executives will need situational awareness of their facilities to manage those events. I think the pandemic will drive businesses toward better systems for dealing with hazards and disaster planning. Longer term, as business leaders grow more comfortable with a remote workforce and flexible working schedules, some might even re-evaluate their real estate holdings and shed leases. It’s really interesting to see how mapping technology is helping guide these decisions.
Article snapshot: Business executives and organisational leaders are faced with the unprecedented challenge of how and where to resume operations following the COVID-19 pandemic. Indoor maps are helping them create and execute plans for a new version of workplace safety.

The business leaders we’ve talked to do not want to totally rebuild floorplans—they want to make adjustments to keep employees safe. Some will create round robin schedules so certain employees are in the office on days when their adjacent neighbours are not.
Pat Wallis, Esri
Navigating a New World of Work
Cross: In the COVID-19 world, what are some emerging uses for indoor mapping?
Isley: Indoor maps are being used in three aspects of the COVID-19 pandemic. The first is direct response. This mostly involves front line locations like hospitals, shelters, pop-up facilities, and campuses that are providing emergency services and health care. They need to understand how to adapt their indoor space to safe distancing, help people find the resources they need, understand and address facility issues, define new health procedures, and more.
The second technique involves planning indoor space for use when employees return to work. Companies need to map out seat assignments and safety procedures and understand who’s in the office, who’s not. They also need to know where maintenance has been performed and how physical systems are operating.
The third is advanced analysis of the indoor environment. For example, companies are preparing response plans in case an employee contracts the virus. They’re looking to create a common operating picture—a real-time map—of the workplace. That’s a new level of indoor awareness for most companies.
Will Working from Home Reshape the Population?
As more employers recognise the benefits of a remote workforce, the dynamics of the country’s demographics could change. Under remote work arrangements, people will be free to live where they choose, rather than where the office is. That could rearrange cities, towns, and rural locations across the country. Companies that have used GIS to analyse consumer and demographic trends will monitor these changes over time and assess their business implications.
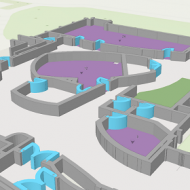
Managers want a real-time view of the office—a common operating picture to help them keep the workplace safe. Indoor maps are helping provide that visibility.
Pat Wallis
How Executives Are Rethinking Indoor Space
Cross: I imagine a lot of the executives you work with are focused on adjusting physical layouts and procedures as they begin to reopen offices. What does that involve, and what’s different about it now?
Ryck: Before the COVID-19 outbreak, companies were focused on maximising space usage, since property is the second-biggest expense on their books. In some cases, they did this through space-sharing practices like hoteling and hot desking. Some of those practices will survive this pandemic—especially since many employees will now work partly from home and partly in the office. But much more governance will be involved. Employees won’t be able to show up at the office and grab an available desk.
Hoteling, for instance, is a managed process—it can be run on interactive maps that account for social distancing. Employees can reserve space on the map, managers can approve the assignments, and the system will alert maintenance staff when shared spaces need to be sanitised.
We see planners using space analysis to find choke points in their facilities and reduce the possibility of congestion. They’re using indoor maps to make adjustments to the space and ensure social distancing.

The old definitions of capacity no longer apply. Companies are trying to de-densify their space, which means they need to closely monitor reduced capacity and make sure they're not putting employees at risk.
Pat Wallis
Data Points toward Phased Openings
Cross: I imagine executives with facilities in multiple states might find it difficult to gauge the readiness of each property. How will they decide when and how to open facilities?
Isley: The business leaders we’ve talked to are doing location analysis. They know that the COVID-19 reality in New Jersey, for instance, is very different from that in Idaho. Even within a state, infection rates and risk levels vary substantially by location.
Executives know how important good data is to good decisions, so they’re using technology like a geographic information system [GIS] for analysis. For example, they might use GIS to analyse data on COVID-19 trends, including statistics such as the number of days since a county’s last reported COVID-19 case and the status of its infection rate—from emergent to end stage. That gives decision-makers the location intelligence they need to make plans specific to each facility.
Ryck: This is where traditional GIS and indoor GIS intersect. Once executives gauge the readiness of each facility based on state and local data, they’ll map out new procedures within each facility.
Cross: How will they deal with the variations across locations—how will that process play out?
Isley: We expect many companies to create a tiered reopening system. A facility at tier two, for example, might enforce certain rules: open space seating is prohibited, no more than 40 percent of the workforce can be in the workplace, and social distancing is managed very strictly. For a facility at level four, that might mean 75 percent of the workforce is back in the office, visitors are allowed with special permission, and common spaces are open but with limited seating in lunch areas.
Employers will design and manage those scenarios on smart maps. When local and county-level laws and data indicate that a facility can move to the next level of openness, a manager can click on the level 3 plan in GIS, and the indoor map will display the game plan for that tier—for managers and employees.
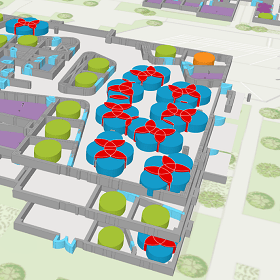
Company executives are monitoring federal, state, and local orders for business openings, and they’re also performing their own GIS analysis to understand the right time for each facility to reopen, and the appropriate restrictions to enforce.
Pat Wallis
Responding to Instances of COVID-19
Cross: Despite their best efforts to protect employees, companies could still face a situation where an employee contracts COVID-19. How will organisations deal with that?
Ryck: The White House issued guidelines stating that employers should be prepared to implement contact tracing if an employee tests positive for COVID-19. The guidelines aren’t specific about how that should happen, so companies are looking for best practices.
Some companies are using location technology on mobile devices to allow staff to self-report. If I’m working from home for the day, I check in on the app, report where I’m working, and note if I have any COVID-19 symptoms. Managers see a map of who’s in the office and who’s off-site, and what everyone’s status is.
This mapping capability supports basic contact tracing, because employee check-ins are saved for a certain period—say, three weeks. If an employee reports symptoms, a manager can essentially rewind the map over the past two weeks and see which colleagues that employee may have come into contact with.
We’re working with large organisations in public and private sectors that are doing this for thousands of employees.
Isley: In certain high-risk work environments, companies will want to do more rigorous contact tracing. They’ll use a combination of mobile devices and indoor positioning technologies like Wi-Fi access points or Bluetooth beacons to understand where employees are as they move through facilities. Apple, Google and other tech companies are providing SDKs for proximity detection, too. If someone tests positive for the virus, algorithms in GIS technology can help managers figure out who that person came into contact with.
New Practices in Every Space
The impacts of COVID-19 on indoor spaces are profound. While offices and other workplaces adjust to a new level of safety, other facilities are doing the same. Airports are looking to de-densify passenger flow through terminals, better manage TSA wait times, and shift people to different locations to minimise congestion.
Schools are mapping new traffic flows to move students from classroom to classroom safely. Across industries, indoor maps are helping planners create safe procedures in a changed world.
Restarting Operations
Cross: So far, we’ve focused on employee activity, but what about the physical operations of offices and workplaces?
Ryck: If facilities have been largely unoccupied or running at minimal capacity for some time, organisations will want to ensure that mechanical systems are functioning safely as operations resume. Historically, maintenance involved a lot of paper-based work orders and physical handoffs. The trend of using digital maps to integrate with work order systems—to manage everything from sanitising common areas to changing air filters—will accelerate. That minimises in-person contact and helps with social distancing.
The Common Operating Picture Moves Indoors
Cross: What I’m hearing across this conversation is that leaders are interested in creating a common operating picture of the workplace. They need to see the workplace in ways they never have before. They need to know how many offices are occupied, where staff are congregating, and which areas need cleaning. Indoor maps are creating that operating picture for managers and executives.
Isley: And for employees, too. Because as space plans change, employees will need to adapt. Some will end up in different office locations, and all will have new procedures to follow. Having an indoor map on their phones will give them the information they need—everything from which areas are off-limits and where hand sanitiser stations are, to the best way to navigate to a conference room or café.
That map will be their common operating picture, and it will update as facilities graduate to fewer restrictions, based on local conditions. This level of awareness will be key to keeping employees safe in a new environment—and helping them and the businesses they represent remain as productive as possible.
Additional Resources for Business and Organisational Leaders: