Blog Archives

Will COVID-19 Rearrange the Global Supply Chain?
COVID-19 has impacted many parts of society. Will it shake the supply chain in ways even climate change and trade wars haven't?
Editor’s Note: For business executives and professionals seeking resources to respond to COVID-19, visit this site dedicated to business continuity.
It has been a dispiriting decade for the multinational COO, keeper of the global supply chain-dispiriting enough to send COOs scrambling for a new model of global production and distribution.
Natural disasters costlier than any in history have battered the globe, knocking out production facilities, damaging transportation routes, and repeatedly interrupting the flow of goods. Economic nationalism has flared, prompting tariffs between world powers and driving up the cost of cross-border trade. Now a pandemic has decimated consumer demand for some products, magnified it for others, and prompted rolling factory shutdowns worldwide.
Signs of shifts and soul-searching are emerging. In October 2019, the American Chamber of Commerce in China and its counterpart in Shanghai asked 25 US multinational companies whether decoupling—separating the US and Chinese economies—would be impossible. Two-thirds said it would be, according to the Wall Street Journal. By March 2020, that number had dropped to 44 percent.
Under siege from climate change, economic nationalism, and COVID-19, the bedrock of global manufacturing for the past several decades—low-cost production in Asian countries and complex, extended supply chains—is showing fissures.
Article Snapshot: Wobbled by outbursts of economic nationalism and increasingly severe natural disasters, then floored by the COVID-19 pandemic, the global supply chain faces critical questions of risk and resilience. Will manufacturers retract into regional supply chains or diversify even more? As they decide, location will be their guide.
To Expand or Contract: That Is the Question
Experts have suggested divergent response strategies. Some say manufacturers should regionalise the supply chain—confining it to a smaller geographic area to create more reliable access to raw materials and finished goods. Others suggest more geographic dispersion—creating redundant sources of supply around the world to dampen the risk of business interruption should a particular region or supplier falter.
Despite the differences, there’s agreement that supply chain visibility is a linchpin of both approaches. As global risk adviser and insurance brokerage Willis Towers Watson recently explained, companies should know who supplies their suppliers. That is, they should inventory the Tier 1, Tier 2, and Tier 3 participants in their supply chain. If executives hadn’t done so before the COVID-19 outbreak, experts say, they need to now. Which means many COOs have a lot to learn—and quickly.
With their March Harvard Business Review article “Coronavirus Is a Wake-Up Call for Supply Chain Management,” Arizona State professors Thomas Y. Choi and Dale Rogers reinforced that view, saying the small group of companies who mapped their supply chains before COVID-19 was better prepared for disruption than those who did not.
As some executives have discovered, supply chain awareness depends heavily on location intelligence.
Mapping the locations of factories, distribution centres, and transportation routes helps a company adjust quickly in moments of crisis—a key factor in mitigating risk. It also gives them a road map to more significant, long-term changes, if they’re bold enough to make them.
Change Is Hard to Come By
Despite profound bruises to the global supply chain in recent years, COOs and their fellow CXOs have maintained a global production paradigm that looks much like it did a decade ago. Many observers predicted otherwise.
As climate change began to materialise in the form of more frequent and punishing storms, wildfires, and other catastrophes, supply chains suffered. The 2011 earthquake and tsunami in Japan are oft-cited examples. Amid the devastation, automakers, chemical manufacturers, and computer companies faced months-long delays in parts and supplies that hobbled production further down the supply chain. After they recovered, some companies increased their safety stock and added buffers to the just-in-time manufacturing model. But few made significant changes, according to Reuters.
In 2018, the US set off trade wars against countries around the globe—most notably China. Billions of dollars in tariffs created a material impact on consumer goods prices and companies’ bottom lines. Supply chain rethinking came into vogue again, and some companies made adjustments. Several Apple suppliers, for instance, initiated plans to move production out of China, according to a Bloomberg report.
But companies didn’t fundamentally change the model. They mostly shifted production to countries such as Vietnam, Indonesia, and India, which means supply chains remain long and complex.
Is the Supply Chain Facing a Liquidity Crisis?
A professor at the University of South Carolina’s Darla Moore School of Business suggests that the US may need a national stress test for its supply chain. In an interview on the school’s website, Professor Mark Ferguson likened COVID-19-related product shortages of personal protective equipment (PPE) to a liquidity crisis. Just as banks lacked liquidity during the 2008 financial crisis, today’s manufacturers lack supplies of critical goods, Ferguson said.
In the case of manufacturers, poor liquidity stems from just-in-time practices, which prioritise limited inventory to minimise carrying costs. As Ferguson notes, the COVID-19 crisis exposed that shortcoming in devastating fashion, and could provoke changes down the road.
A Feeling of Inertia, Interrupted by a Pandemic
So why have most global CXOs balked at fundamental supply chain changes?
In a recent MIT Sloan Management Review article, Harvard professor Willy Shih pointed to a decidedly human answer: complacency. Even after Japan’s 2011 earthquake and nuclear meltdown and a spate of trade wars, he wrote, some executives felt locked in to the model of Chinese production that has fuelled global supply chains for so long. For CXOs, change isn’t just unsettling; it’s also expensive.
Now, after years of discussion about restructured supply chains, the COVID-19 pandemic is delivering another powerful provocation. Like the Chamber of Commerce polls in China, a series of PwC surveys suggests COVID-19 might stir change. The consultancy has asked global CFOs what supply chain changes they plan to make in response to the pandemic. In late April, the most popular response—with 52 percent selecting it among their top three—was to develop alternate sources of supply.
Still, the study’s authors call supply chain relocations a last resort, due to the expense. What they expect is for manufacturers to invest in forms of automation that will deliver improved data and help them make better decisions.
Companies with a GIS-powered map of their supply chain can quickly analyse two critical pieces of information—the location of suppliers and the materials at risk due to a disruption.
The Visibility Challenge: Mapping Today’s Supply Chain
Which brings us back to the strategy everyone seems to agree on: mapping a company’s supply chain. Whether executives intend to make major changes, or simply want to be prepared for on-the-fly adjustments during a disruption, they need visibility before they can make good decisions.
US automaker GM provides a meaningful example. After more than a century in business, the company has learned a thing or two about global supply. Its supply chain risk management team led an effort to map suppliers and distributors worldwide—including where they are, what they produce, and where it goes next. Once team members gathered that data, they placed it in a geographic information system (GIS) for mapping and analysis.
Using GIS and companion technologies, the risk management team monitors alerts for disruptive events worldwide. Based on the location and scope of each event, the team quickly generates a map that shows which suppliers are affected and which parts and materials they deliver to GM plants. Alternate sources of supply can then be pinpointed and ramped up.
The interactive map helps the automaker navigate quickly around disruptions. Due to its risk mitigation capabilities, it has also lowered the company’s insurance premiums.
While this brand of location intelligence is pivotal in helping GM analyse and respond to supply chain disruptions, it exists thanks to a lengthy data gathering process. Mapping the supply chain involves talking to each Tier 1, Tier 2, and even Tier 3 and Tier 4 supplier, carefully cataloguing where they are and how they contribute to the network.
Arizona State professors Choi and Rogers call the process of supply chain mapping resource-intensive and difficult. But they note that during the COVID-19 outbreak and other disruptions, executives who understood where parts and sub-assemblies were produced, where distribution centres were located, and how materials flowed along supply routes were the first to arrange alternate sources of production.
Scenario Planning for Tomorrow’s Supply Chain
The question that dogged COOs before the COVID-19 pandemic will surely remain when it subsides: Is it best to tweak, maintain, or redesign the global supply chain? The forces behind that question include climate change, economic nationalism, and now a worldwide health emergency.
For executives who choose to make strategic adjustments, GIS’s analytical capabilities play a role. For instance, analysts can map out what-if scenarios for a company contemplating smaller, regional supply chains. They might map several distribution models to see how reliably and cost-effectively goods will reach target markets from various production hubs.
A recent World Economic Forum blog summarises the importance of supply chain visibility succinctly. During normal times, the authors write, visibility helps companies drive efficiency into their supply chains. During disruptions, visibility is crucial to understanding impacts and executing workarounds.
According to PwC, it’s too soon to tell whether the supply chain will change markedly following a decade of disruption. The world feels especially unstable right now, and when risks accumulate, humans often cling to the comfort of routine.
Regardless of whether global executives make big changes or incremental ones, the best plans begin with a map.
Global Supply Chains under Siege
A short list of the factors causing COOs and other executives to rethink the supply chain:
- Climate change and the associated risk of natural disasters
- Economic nationalism and the cost of cross-border tariffs
- Corporate social responsibility and reputational risk from overseas labour practices and environmental practices
- Global transportation costs—always a moving target for supply chain planners
- A general desire for visibility and control
The increasing scrutiny of insurers as supply chain risk and volatility grow
This article was originally published in the global edition of WhereNext.

Certainty in Uncertain Times
Respond effectively to COVID-19 using authoritative, up-to-date data you can trust with absolute certainty.
Respond effectively to COVID-19 using authoritative, up-to-date data you can trust with absolute certainty
These are undeniably uncertain times. The emergence and rapid global spread of the COVID-19 virus has led to unprecedented social distancing measures, placed the healthcare and voluntary sector under immense pressure and forced businesses and emergency services to embrace entirely new ways of working. It is difficult to anticipate when the crisis will abate, how a gradual relaxation of the current restrictions will be implemented and when, or even if, life will return to the way it was before.
Almost every day, changes are occurring that affect everyone and every organisation. When we tune in to the British Government’s 5pm daily briefing, we could discover that the circumstances we have planned for today will be entirely different tomorrow. In this constantly evolving situation, it is vitally important for all public sector bodies, private sector businesses and not-for-profit organisations to be able to respond and adapt quickly.
Throughout the UK and the globe, organisations of all kinds are turning to geographic information systems (GIS) to help them make the rapid decisions they need to make in this ever-changing and unpredictable new world. Esri’s ArcGIS platform provides people with the dashboards, apps and tools they need to analyse, forecast and understand the ‘new normal’. Yet technology alone is not enough. Unless people also use appropriate, up-to-date data in their GIS systems, and select that data from authoritative sources, the decisions they make could be flawed.
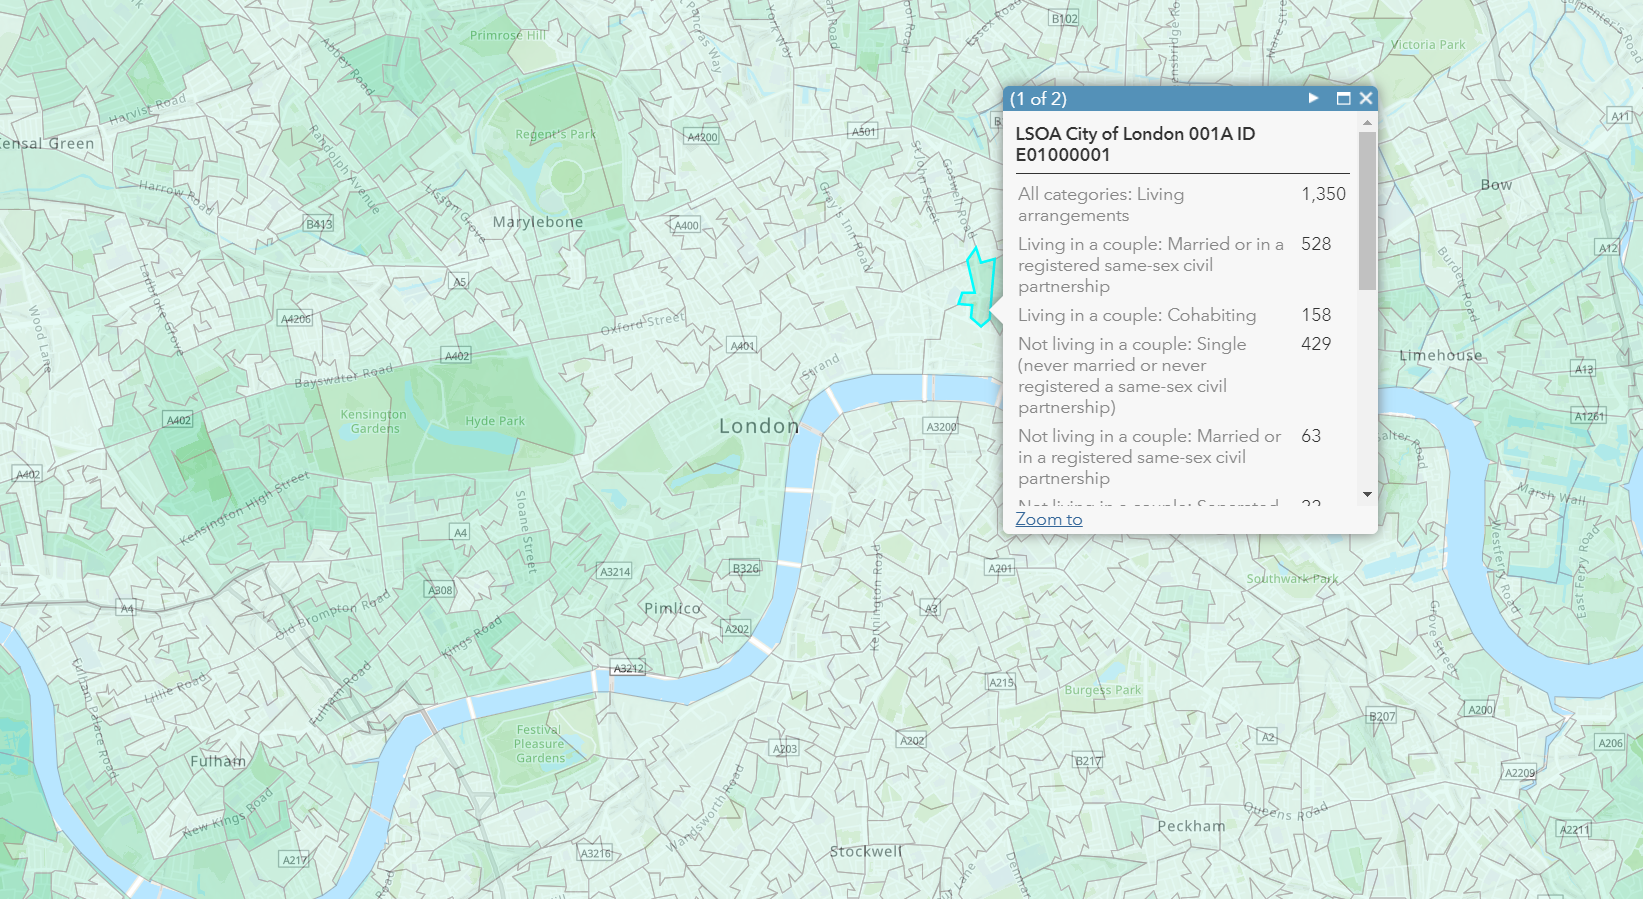
This is why Esri UK has created a COVID-19 Data Hub that brings together, in one place, a wide range of incredibly useful data sets. This data can be integrated into existing ArcGIS systems or used to create a host of brand new rapid response GIS dashboards and mobile solutions, specifically designed for COVID-19 initiatives. County data can also be viewed online via the hub, in ready-prepared Local Authority Data Reports.
Easy to use and entirely free of charge, the data hub makes it far easier for people to find the data they need and therefore launch new initiatives in response to COVID-19, more quickly. Most importantly, all of the data in the hub has been carefully curated to make sure that it is the best available data, from reputable sources. By drawing on the data resources in the hub, users can be confident that their data is both up-to-date and authoritative. They can therefore make important decisions with greater certainty.
The Esri UK COVID-19 Data Hub presents data in five categories:
- Coronavirus cases
See where large clusters of cases are still occurring and monitor whether daily deaths are beginning to reach a peak. Use this information to evaluate whether local healthcare services have the capacity for expected patient numbers and to locate community-based services in the right places to meet demand.
- Health
Allow users to identify their most vulnerable people, including people with health deprivation and disabilities, low-income households, homeless people and rough sleepers. Draw on this insight to direct the services of voluntary groups and local authorities to those who are most in need of support.
- Infrastructure
Pinpoint the locations of sites where people may congregate such as supermarkets, pharmacies and parks to implement and enforce social distancing measures. See all UK ports and train stations to quickly build new supply chains and distribution networks for importing Personal Protection Equipment (PPE) and other goods to new destinations.
- Population
Find out about average household sizes and UK living arrangements to identify elderly people living alone who may appreciate help with shopping or occasional telephone calls to reduce their feelings of loneliness.
- Boundaries
Use boundary data to see which agencies and local authorities are responsible for which groups of citizens and services. Apportion tasks to different voluntary organisations or groups in different locations to ensure that no one is overlooked.
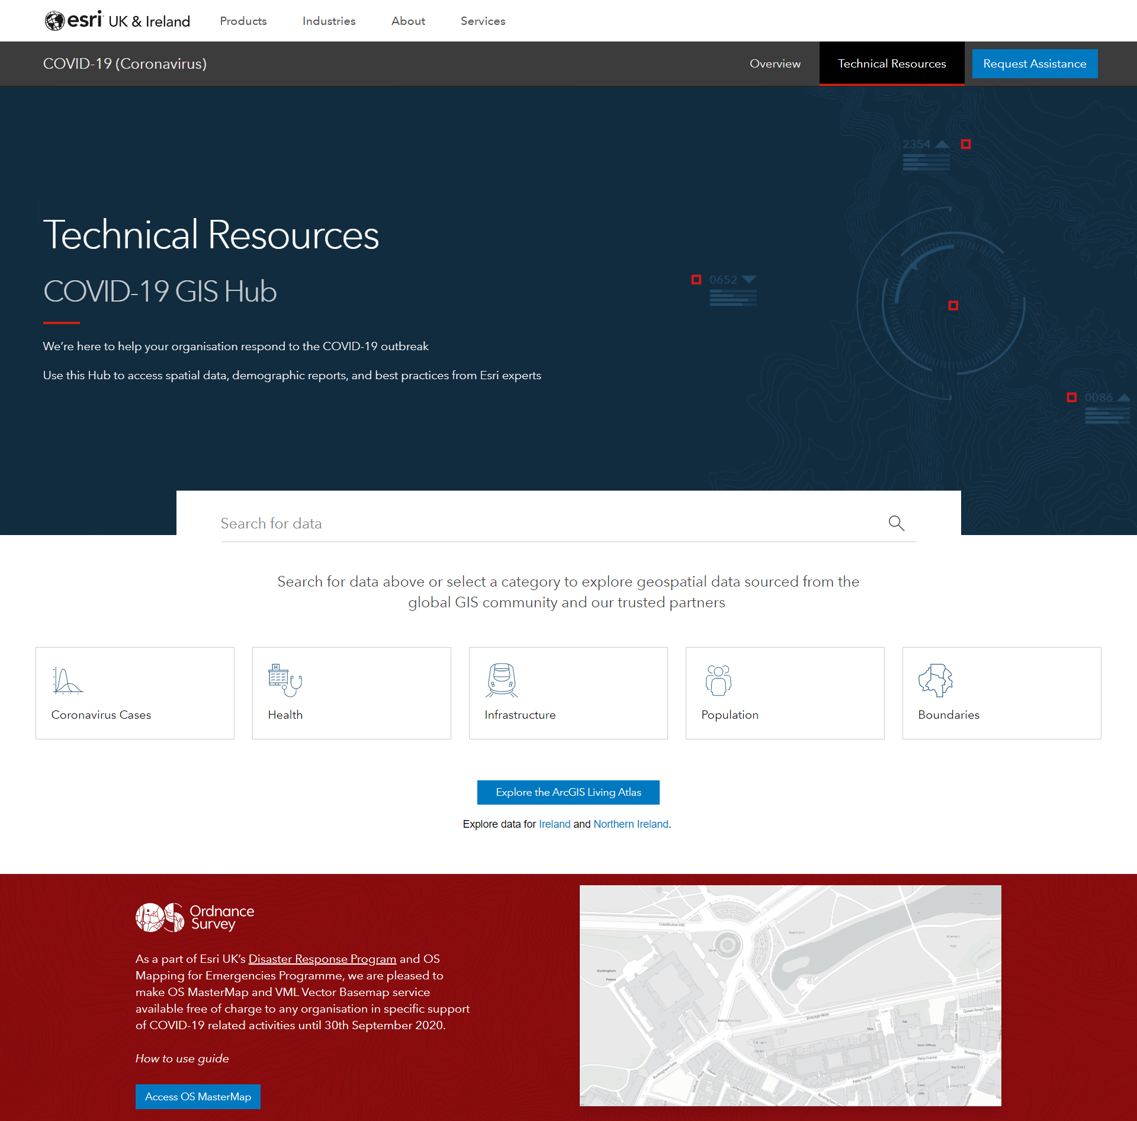
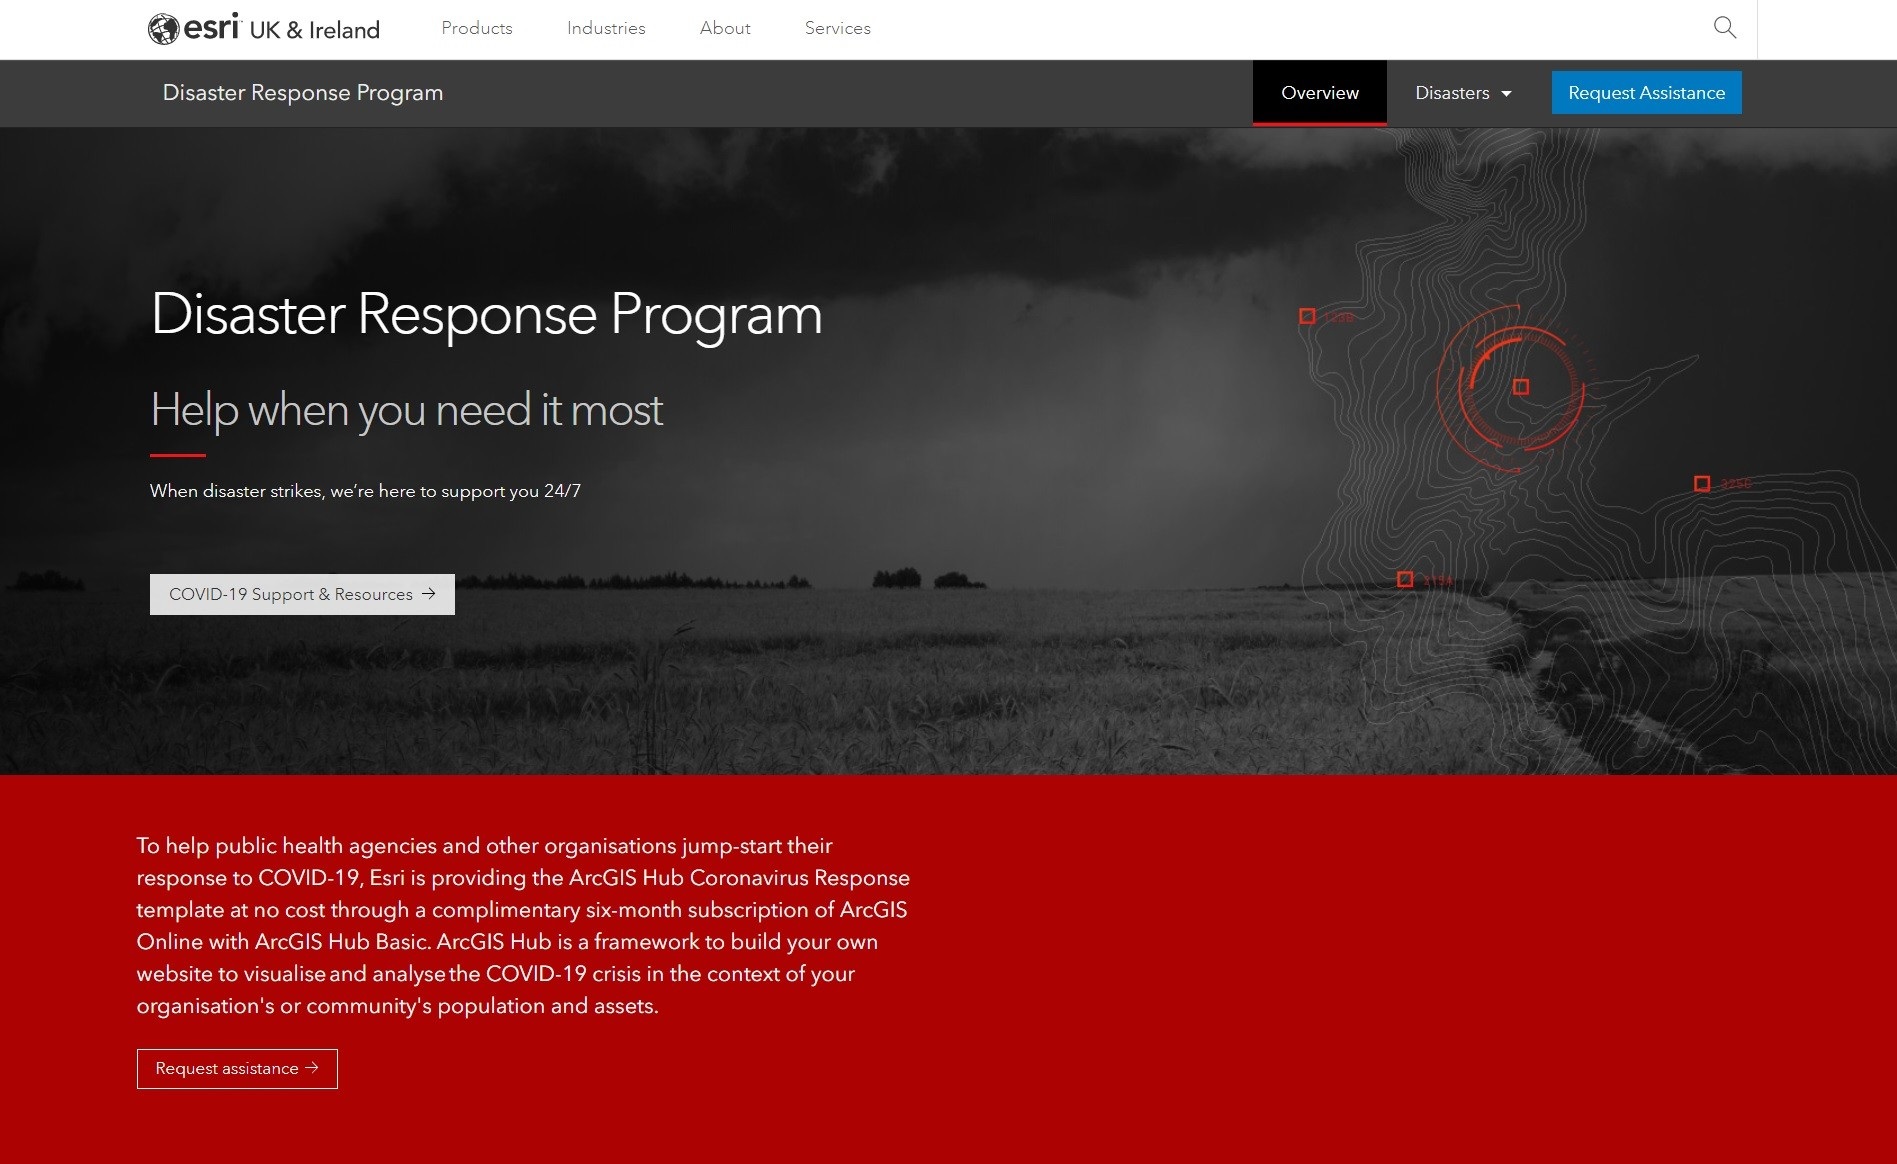
This COVID-19 Data Hub doesn’t just comprise of carefully curated Open Source data. Esri UK is working with its network of premium data providers, who are making their data freely available throughout this current crisis. For example, as a part of Esri UK’s Disaster Response Programme and Ordnance Survey’s Mapping for Emergencies Programme, Esri UK has been able to make OS MasterMap and VML Vector Basemap services available free of charge, through its Data Hub, for any organisation to use to support COVID-19 related activities until 30th September 2020.
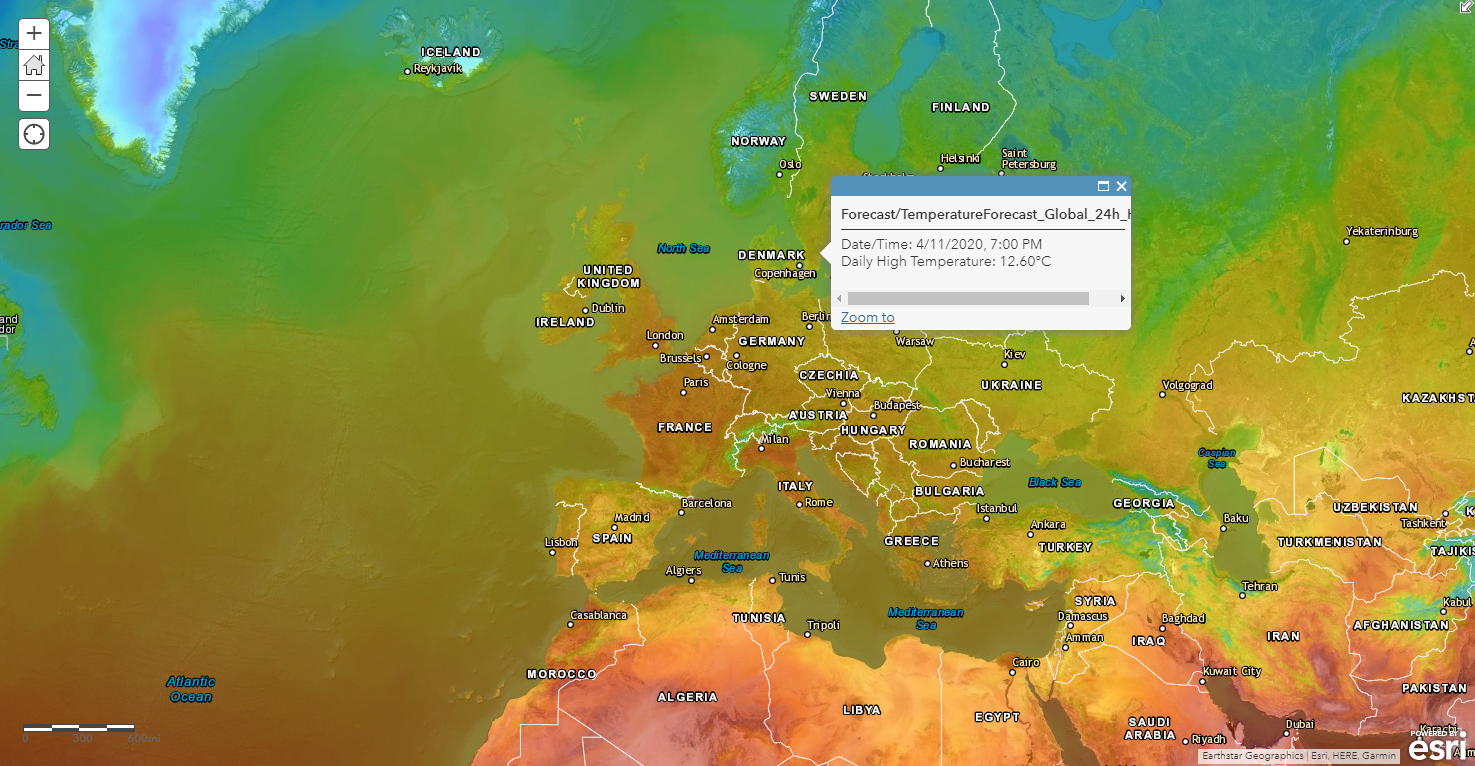
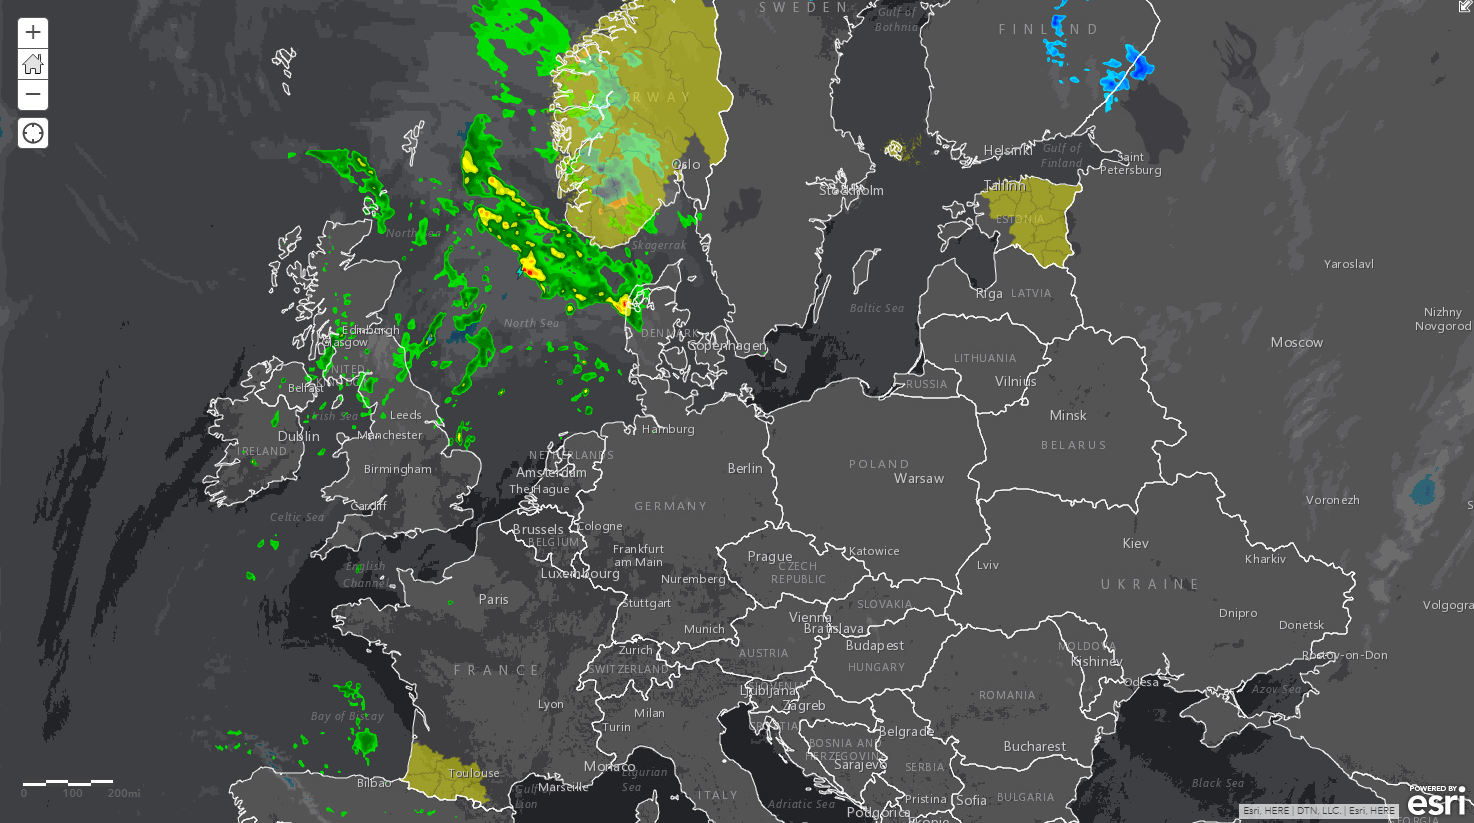
In addition, Esri UK has engaged with DTN, an industry leader in the provision of weather information, to make rich weather data and 10-day forecast services available through the COVID-19 Data Hub. ArcGIS users can use this data to anticipate the effect sunny weather might have on social distancing during the upcoming May Bank Holidays in our local parks and recreation areas. Critically, organisations will be able to monitor for any extreme weather events – like the flooding experienced earlier this year – that might coincide with the COVID-19 crisis. They can then take steps to help prevent our already stretched emergency services from becoming overwhelmed.
It is amazing to witness the ingenuity of people who are already using GIS to help solve the problems that our society is facing. There are some great examples of this work in the Esri “Global COVID-19 Community Gallery” which people can draw upon for inspiration to support their own initiatives. However, all this creative work needs to be underpinned by fast access to trusted data, to ensure that GIS professionals spend time analysing and solving problems rather than sourcing and preparing data.
We are continuing to evolve the data available in the Esri UK Covid-19 Hub, so if you have any suggestions or if the data you need is not already in there, get in touch and we will help you find what you need. Whether you are coordinating volunteers, delivering key services, sourcing vital supplies or just adapting to survive, we aim to provide friction-less access to the authoritative, up-to-date data you need to make decisions with certainty in these very uncertain times.
 James Harvey - Esri UK
James Harvey is Head of Content at Esri UK. Having worked in GIS for over a decade, he understands the pivotal importance of quality, authoritative content and focuses on providing people with the data they need to solve all kinds of business, societal, environmental and healthcare problems.

COVID-19: Taking Comfort from the Past
Calling the COVID-19 pandemic the new normal may miss the fact that throughout history, normal is constantly changing.
We should not be quick to call this the new normal. Normal has always been something of an illusion.
The COVID-19 pandemic has altered the world swiftly and profoundly—and will continue to in the weeks and months ahead—but it is valuable to remember the long view.
The urgent challenge is to solve the medical crisis and the now-unfolding impacts to the economy. But as we start to look forward, we should remember that throughout history, the world has found a way through eras of upheaval and even tragedy. Across time, societies have endured terrible hardships that feel novel each time—and sometimes close to unbearable. And each time our resilience is tested, we’ve struggled toward betterment.
Disruptive and terrible moments like this push leaders to think in new ways, mine new sources of information, and change the way they operate—sometimes fundamentally.
As we consider how the COVID-19 outbreak might shape people, organisations, and companies in the years ahead, a look back might offer insight and hopefulness.
Article snapshot: Few decades pass without an event that changes the world. No matter how widespread each event is, its effects are best examined one location at a time.
The Impact of Major Events
Following the Great Depression of the 1930s, people shifted toward frugality. Some adjusted in small ways—by reusing aluminium foil or watching their water usage more closely. Many changed larger habits. By 1940, the savings rate, which had been negative, surpassed 15 percent as people protected themselves against the risk of another contraction. Automakers like GM moved aggressively to accommodate the decrease in household spending, ramping up production and marketing of its low-cost Chevrolet brand. That shift helped lead to a time when nearly every family could afford a car. Still, that change didn’t happen en masse—car-buying habits varied across demographic groups and locations.
During World War II, the military appetite for steel and other metals drove manufacturers to embrace alternate materials for consumer goods. That fed a surge in plastics innovation and production which continued for decades, shaping regional manufacturing economies, inspiring new consumer habits, and altering the environment.
Then in fairly quick succession, major events continued to punctuate what might otherwise have been called normal times: the space race, civil rights struggle, Vietnam War, economic globalisation, and internet-based communications changed society and culture dramatically.
Starting in 2007, the Great Recession severely impacted labour dynamics, driving many middle-skilled workers—in manufacturing, administrative, and similar jobs—out of the workforce. Subsequent studies of location data revealed that US counties with higher levels of income inequality were less able to withstand the economic downturn. The fallout from that disparity continues to influence a patchwork of economic conditions and even voting patterns today.
COVID-19’s effects have been widespread, but by no means universal. Different parts of the world have experienced different rates of infection and impact. In the US, New Jersey had more than 64,000 COVID cases as of April 14, while Maine had fewer than 700. Italy had lost 20,000 citizens to the virus, while in Greece, fewer than 100 had died.
In ordinary and extraordinary times, location shapes what people experience and how they view the world. That reality should be embraced by executives and leaders as they create plans for business recovery in the days and weeks ahead.
In retrospect, the events that make history tend to define our views and societies more emphatically than the “normal” times that pass quietly between them.
What Changes Will Come
At the moment, many business leaders are practising what might be called COVID-19 protectionism—ensuring the well-being of employees, idling non-essential production and services, and planning for recovery when conditions allow.
It has been heartening to see so many of them rally around their employees, customers, and front-line workers. This list of companies taking action is welcome evidence of the business community’s commitment to corporate social responsibility, and a reminder of the resilience that often shines during shared hardship.
As we begin, perhaps warily, to map out recovery plans, it is important to recall the major shifts of decades past, to consider how this pandemic may influence habits and views, and to assess where and how businesses will change as a result. Here are a few examples where this dynamic is already playing out:
Commercial Real Estate and Corporate Offices
Millions of professionals are now working from home, and when COVID-19 shelter-in-place orders recede, some percentage of them will likely become permanent or semi-permanent remote workers. For those who return to the corporate office, things may change, too. Cushman & Wakefield, a top corporate real estate firm, has formed a task force to advise clients on how to set up what it calls “the 6-foot office”—a space that encourages social distancing and better protects employee health.
The push toward more careful space planning is likely to change the CRE industry and corporate offices for years to come. HR planners and corporate leaders have already used indoor location technology to map facilities and understand their asset usage. That same tech will play a central role as they reconfigure offices for a post-COVID reality.
Many companies shifted a large percentage of employees to home-office work in just weeks or months to accommodate coronavirus shutdowns. When executives have more time to assess the long-term options for remote work, they’ll rely on new sources of information, including data on which towns or neighbourhoods have reliable access to broadband service. (see the sidebar for more.) With that location intelligence in hand, some executives might seek creative ways to partner with broadband providers to improve access for people on the wrong side of the digital divide.
Remote Readiness by Location
As the COVID-19 outbreak unfolded, the team at SmartAsset examined occupation data from the Bureau of Labour Statistics to determine which US locations were the most receptive to remote working. The analysis was based on the prevalence of certain occupations in a location, and did not directly account for digital access. Its results are an interesting read—from the finding that Arlington, VA, has the best profile for remote work, to the discovery that Sunrise Manor, NV, is least equipped to make the shift. For data on broadband access across the US, visit this smart map.
A Retail Industry in Flux
Effects of the COVID-19 outbreak on the retail sector have been stunning. Shutdown orders have driven some companies toward the brink, while others have benefited from spikes in online shopping or have found creative forms of contactless delivery to keep customers safe.
Business leaders who embrace new customer expectations during the pandemic are likely to retain many of those customers in the long run. As Gartner’s Amie Song told AdWeek recently, Chinese online retailers JD.com and Tmall grew precipitously in the early 2000s after the SARS outbreak scared many shoppers away from stores and onto computers and phones.
Today, eCommerce is ingrained in our shopping patterns, but it still accounted for just 10 percent of US retail sales at the close of 2019. COVID-19 is changing that dynamic, as evidenced by March’s 74 percent year-over-year increase in online sales. Like social distancing in offices, online shopping habits formed during the COVID-19 pandemic may persist well beyond the crisis. Those preferences will differ in each global location, and businesses that use location data to understand them will find ways to cater to evolving tastes.
In a retail climate where fashions change rapidly, calling something the new normal is a misguided approach. Companies that stay nimble and explore emerging sales techniques may manage to make a positive impression on shoppers long after COVID-19 fades.
Manufacturers Locate Weak Spots
COVID-19 has changed the fortunes of many manufacturers nearly overnight. Late in March, sales of hair clippers rose 166 percent from a year earlier as at-home hair care caught steam. Meanwhile, makers of products as diverse as video game consoles and toilet paper couldn’t keep their offerings in stock at retail outlets. On the flip side, milk producers were dumping excess product as restaurants idled and grocery shoppers opted for less-perishable foods. Automakers reported sharp sales declines, with more likely to come, and some paper mills went on hiatus as shuttered schools and offices undercut demand for paper products.
The pandemic has exposed many truths about manufacturing, but most prominent is the benefit of knowing your supply chain.
When a slowdown or surge like that brought on by COVID-19 hits, manufacturers that use GIS technology know the exposure risk at their tier 2 factories, the status of finished goods in transit, and where demand for products is outside normal levels. Some have built that supply chain awareness over years to cope with natural disasters; more will in the near future.
As they do, they should consider which forms of customer demand will reach beyond the crisis and which may emerge. For instance, following the SARS epidemic of 2003, many Beijing residents bought cars to avoid what they saw as the public health hazards of public transportation. The COVID-19 pandemic could reset transportation attitudes in similar ways. Executives can use GIS to track consumer sentiment in locations worldwide and prepare for consumer changes.
Banks and Financial Services Institutions
Before the COVID-19 outbreak, bank leaders were already becoming savvy students of location information. In the wake of the virus, wise executives will pay greater attention to how location affects their customers.
COVID-19 has exposed glaring inequities across the country and the world. In addition to early indications that the disease disproportionately imperils minority populations, we’re also reminded that many communities lack access to key services, including healthcare, the internet, and banking.
As of early April, the pandemic had produced a 50 percent jump in online banking as home bound citizens turned to mobile devices to manage finances. While some communities have contributed heavily to that surge, others have been left out due to poor digital access, lack of bank accounts, or both.
That may prompt some bank executives to continue rethinking the purpose and format of branches. Consider the innovative Capital One Cafés, designed to resemble coffee shops more than traditional bank branches. Aimed at Millennials who might otherwise shun traditional banking options, the locations debuted in 2017 featuring resources such as community rooms for local nonprofits, free money coaching, and WiFi-equipped meeting spaces.
The COVID-19 experience will likely change banking habits even further. People who had access to mobile services may emerge from the pandemic confident that they can handle finances exclusively online. Others may see ever more clearly the need for in-person options.
Some banks are already experimenting with a middle ground, including the delivery of banking services via customised trucks that visit neighbourhoods on a rotating schedule.
Decisions on whether and where to expand such services will be highly influenced by the needs of individual neighbourhoods, something leading banks have been analysing with GIS technology for years. As pandemic restrictions begin to fade, the demands on banks will continue, but the complexion of their presence in many locations may well change.
Data Analysts Drive Decisions across Commercial Industries
Throughout the COVID-19 crisis, one group of employees has been busy helping executives and colleagues navigate important decisions. Analysts and data scientists have been the news gatherers of this pandemic, using GIS technology to map conditions for many types of business. They’ve used data from inside and outside their companies to deliver intel on the well-being of employees and customers, while making sense of health and business conditions around the world.
At one retailer with a presence in almost every US state, the pandemic immediately raised executives’ interest in smart maps and dashboards. Analysts used GIS technology to map store-level data that had been confined to spreadsheets, creating near real-time maps of store openings, employee availability, and COVID-19 cases in each location’s county.
At a US grocer, the emergency operations centre quickly became the GIS team’s biggest client. Analysts delivered location intelligence on maps and dashboards, creating situational awareness to help executives make key decisions on employee and customer health.
Locating a New Definition of Normal
On the far side of the COVID curve, these teams of location specialists will remain vital, providing insight on how and where businesses can ramp up safely and effectively to meet emerging customer needs.
It may be jarring to think that days of turmoil are closer to normal than we imagine, but it’s also comforting to remember how resilient we can be. And while consumer habits and world views may vary by location, it’s encouraging to know that perseverance is universal.
Additional Resources for COVID-19 Response:
- A podcast on mapping, visualising, and understanding the crisis [listen to the podcast]
- An inventory of some of the ways businesses are protecting employees and customers during the pandemic [read the article]
- A site featuring location technology resources to help with business continuity and recovery [explore the site]

Just Add Ingenuity
Use out-of-the-box ArcGIS tools and a little imagination to help you respond to the challenges of COVID-19.
Use out-of-the-box ArcGIS tools and a little imagination to help you respond to the challenges of COVID-19
Ingenuity is emerging as one of the most powerful tools for combating COVID-19.
Right across the UK, organisations large and small are thinking laterally and coming up with creative ways to use the resources they already have to help improve the nation’s response to this virulent disease. Whisky manufacturers are repurposing their supplies of alcohol to make hand sanitisers; automotive and aerospace manufacturers are using their production lines to make ventilators; and teachers are using equipment in design technology classrooms to make protective face masks for clinicians. Who would have thought this was even possible just a few weeks ago?
The speed at which COVID-19 is spreading throughout communities, countries and continents means that there simply isn’t the time to develop new technologies, specify and procure new materials and learn new skills. Organisations therefore need to be able to take advantage of what they already have, along with readily accessible, out-of-the-box tools that are easy to use and quick to deploy.
Esri’s ArcGIS includes a host of easy-to-use, web-based and mobile software tools and bespoke solutions that can be put into action very quickly, straight out-of-the-box, without the need for custom development. Now free of charge to organisations that want to use ArcGIS software and solutions as part of a COVID-19 response initiative, these highly versatile tools can help organisations address some of the most pressing challenges that this crisis has presented so far. All organisations need is a little imagination – or ingenuity – to see how they can apply this geospatial analysis and visualisation software to the specific challenges they face.
Meet the needs of vulnerable people
Voluntary groups, local authorities and healthcare organisations urgently need to pinpoint the locations of vulnerable people within communities and then match them with the nearest volunteers who are available to help them or support services. One of the world’s largest humanitarian organisations, American Red Cross, uses ArcGIS to identify the locations of people displaced from their homes following storms and floods, on interactive digital maps. It can then direct emergency food and medical supplies to the right locations as quickly as possible. Teams working hard to reduce fatalities from COVID-19 can use ArcGIS in the same way to create an interactive map of vulnerable people and ensure they receive the best possible support to keep them safe.
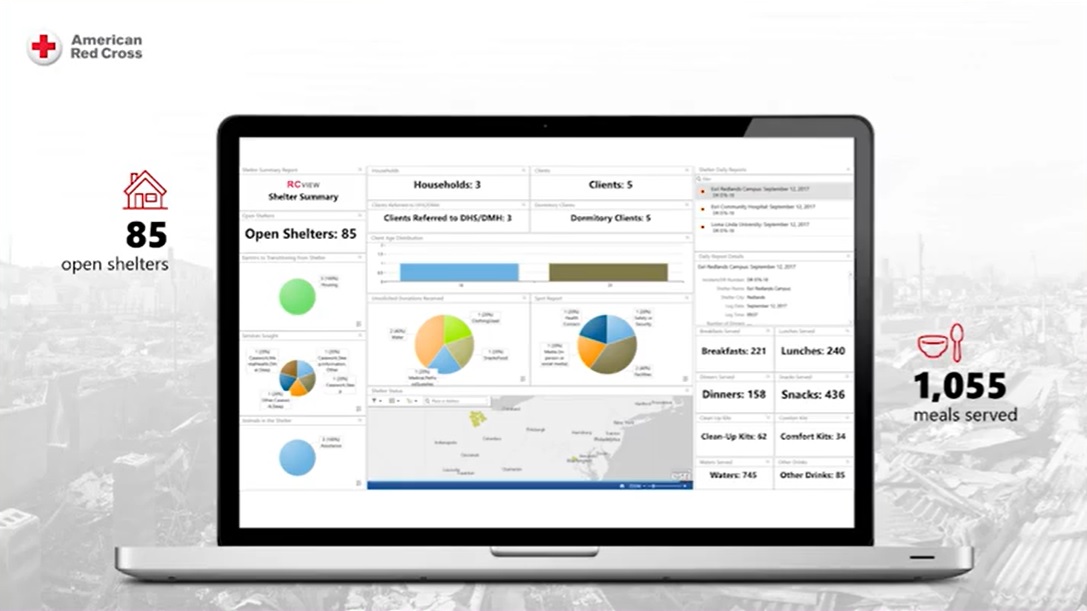
See the American Red Cross presentation from the Esri UK Annual Conference 2019.
Improve the effectiveness of volunteers
Having had an overwhelming response from people who are prepared to volunteer during this crisis, local authorities and charities now need to ensure everyone makes a really effective and valuable contribution. Much can be learned from the pioneering work of a leading conservation charity, which is currently using ArcGIS mobile solutions in a series of pilot projects to enable its volunteers to submit information to a central portal using their smart phones. Similar ArcGIS apps can be rolled out very quickly, allowing large numbers of volunteers to share information about the specific needs of the shielded and most vulnerable people privately and securely, as well as collect and submit information to help ensure residents get the right support during isolation.
Monitor the rapidly evolving situation
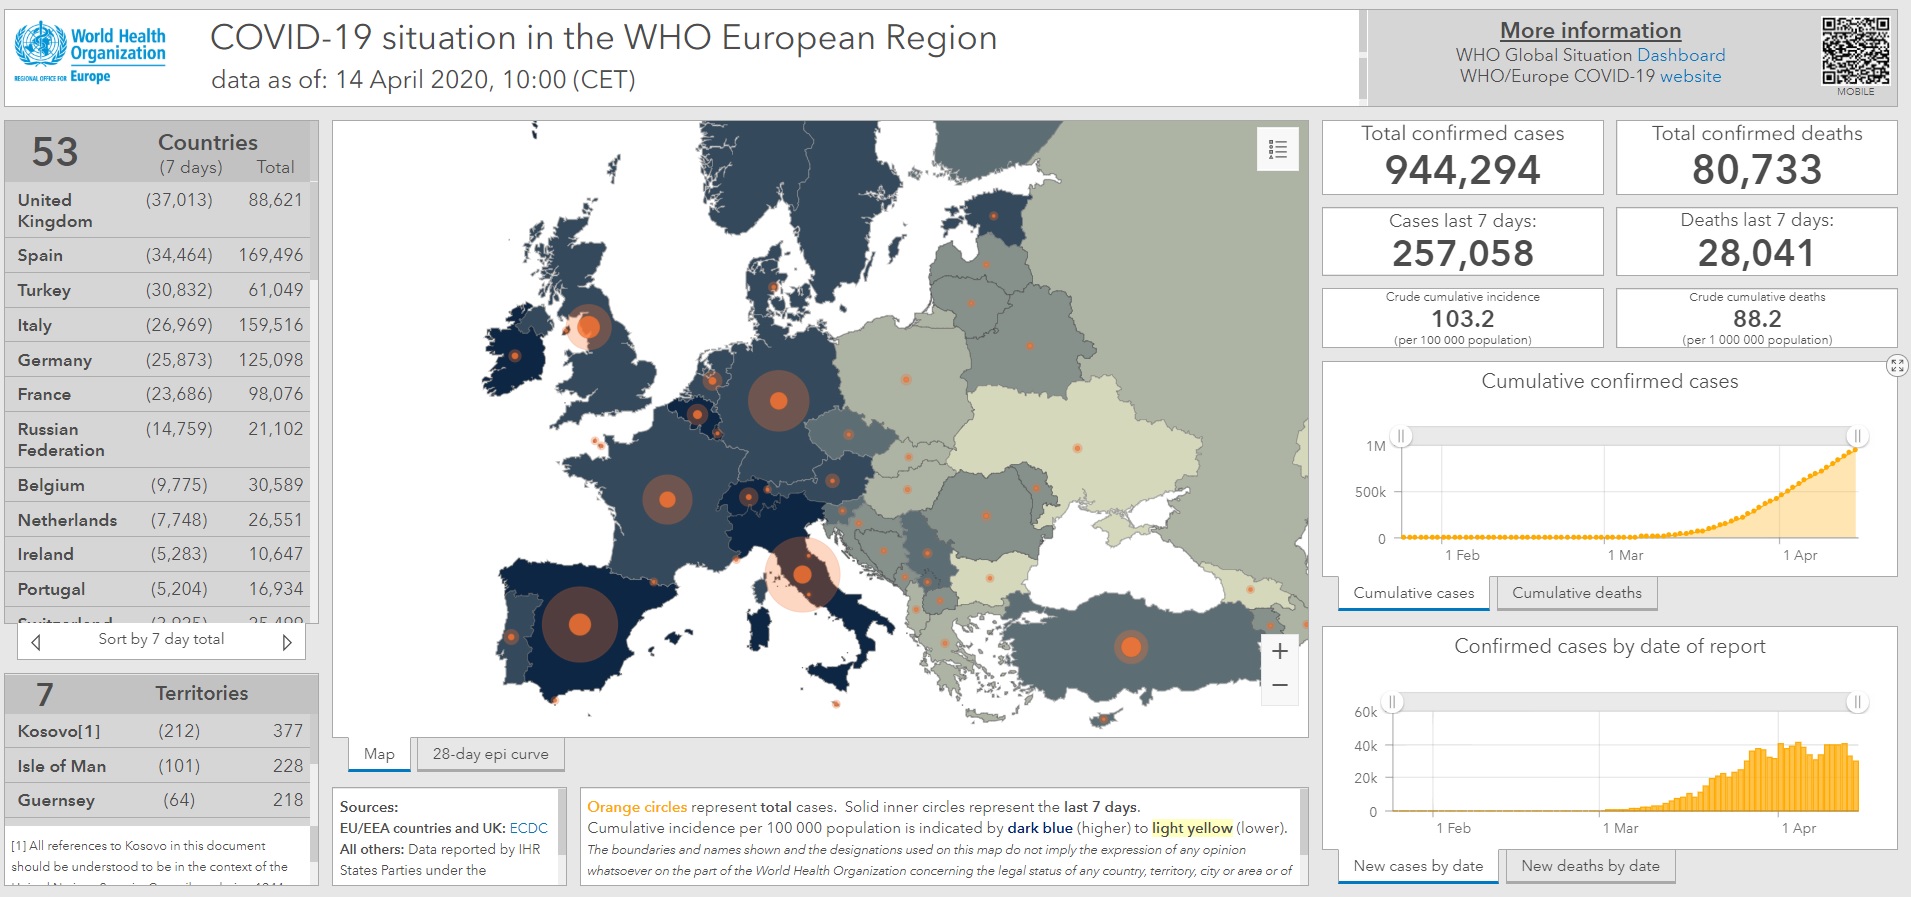
Every day, there are new COVID-19 cases, in different locations, fresh requests for help from the vulnerable and, sadly, additional deaths. ArcGIS provides a way for people to monitor this rapidly evolving situation on interactive maps, so that health advice, volunteer-led support services and emergency care can be directed to the right places, at the right time. Esri ArcGIS Dashboards, like those currently used by large utility companies to respond to emergency call outs, can be quickly set up, providing local authorities, healthcare trusts and voluntary organisations with a real-time overview of the crisis and the insight they need to make rapid, well-informed decisions.
 With every day that passes, the challenges relating to COVID-19 are multiplying. The challenges above will not be the only ones that society needs to resolve and no one can truly anticipate what will happen next. However, ArcGIS has the versatility to help all kinds of voluntary groups, public and private sector organisations, the armed forces and government to gain a better understanding of people at risk, the spread of the disease, the locations of support services and the priority need for resources. It’s ready to go, straight from the box, and it’s free in this crisis. So all you need is a little ingenuity to discover how it can help you and others to make the best possible decisions and safeguard lives.
To learn more about the resources available to support your response to COVID 19 please visit out website where you can register for free software. https://www.esriuk.com/en-gb/covid-19/overview
 Miles Gabriel - Esri UK
Miles Gabriel is currently leading Esri UK’s COVID-19 Disaster Response Programme. He is a passionate geospatial data specialist who focuses on helping customers realise the benefits that geography and location can bring to all aspects of their business.

Artificial Intelligence and Location Intelligence: A Business Guide
For business executives intrigued by AI but confused about its risks and rewards, a primer on location intelligence offers critical context.
To guide their companies through economic shifts, senior executives must understand how technology supports business strategy. Today, that awareness includes artificial intelligence (AI). But without business context, AI will deliver limited value.
Forward-thinking executives are discovering that a complementary technology can contextualize AI information and help them discover new markets, better understand and serve customers, improve asset management, optimize their supply chains, and mitigate risk.
Most C-suite executives sense that AI is a crucial aspect of digital transformation. Three out of four business leaders say they are working to integrate company-wide AI initiatives, according to an Accenture survey. The same percentage believe that if they fail to do so, their companies will be defunct in five years.
Article snapshot: Business executives, pressed to deliver on strategic goals like market growth and risk mitigation, find important context in combining artificial intelligence with location intelligence technology.

The next half-decade will be crucial. McKinsey research suggests that the AI adoption rate among corporations will rise steadily during this period—then increase significantly.
The Business of Machine Learning
In a business context, AI often refers to machine learning. By studying enormous datasets, this type of AI learns to spot patterns, draw conclusions, and even offer predictions. Around one in five C-suite executives say they already use machine learning in some capacity.
What these early adopters—and those who follow—will discover is that the insight generated by machine learning, no matter how advanced, is not enough to accomplish strategic goals. For an AI program, the world is numbers, images, and patterns. For an executive, the world is a place where events occur in certain locations at specific times. Even the best machine learning analysis needs real-world context.
Location intelligence (LI) provides the foundation for that context. Recent technological developments have brought LI and AI together in a hybrid sometimes called GeoAI. Geographic information system (GIS) technology generates location intelligence, and through GIS, executives can bring geographic context to AI and discover insight on key decisions.
The combination of machine learning and location intelligence helps executives drive strategic initiatives including market growth, customer engagement, and risk mitigation.
Predicting and Discovering New Markets
According to a Gartner survey, 53 percent of CEOs list growth among their top three priorities. And while the COVID-19 pandemic has idled many growth plans, some executives are already planning for recovery. Once that phase arrives, companies that most effectively use insight and predictive capabilities will outpace their industries, according to McKinsey. An AI-fueled approach to location intelligence can support those plans and foster growth in three ways: by automating processes, detecting patterns within large sets of data, and making predictions.
Imagine a bank’s planning committee analysing the expansion possibilities in a particular city. Using GIS-based machine learning, they can explore the sales data of existing branches and the demographics of surrounding neighbourhoods—along with the site’s proximity to the bank’s own branches and competitors’. The machine learning program predicts locations that would yield the highest returns with the least cannibalization of business at existing branches.
Renewable energy companies already use machine learning and location intelligence to understand potential markets. Decision-makers at a solar company, for example, can use AI-based image detection to assess a neighbourhood’s viability for solar panels, even crunching historical weather data to calculate the ideal placement of roof panels for maximum sun exposure.
Virtually any business can employ a combination of AI and LI for growth planning.
Uncovering Hidden Patterns in Market Data
Another combination of AI and LI uncovers patterns and offers predictions so executives can discover trends and hot spots lurking in enormous datasets.
A wireless service provider, for example, can combine machine learning and location intelligence to detect trends and guide business investments. Company planners might perform a GIS-based cluster analysis of dropped calls to identify areas where additional cell towers are needed. When they add demographic predictions to the maps, executives can see where population growth will create pockets of potential new subscribers. This allows the company to prioritize network build-outs to meet demand.
Prediction represents the cutting edge of machine learning and location intelligence. Analysts have even used GIS-based machine learning to solve one of the most complex phenomena in retail—the so-called “halo effect”—in which a store’s sales and nearby online sales are mutually reinforcing.
Through a process called “quantifying proximity,” location technology reveals where physical stores will maximize online sales. To do this, a GIS-based machine learning program models the likely performance of stores in different geographic areas—neighbourhoods in a city, for example, or cities across the country—by analysing factors such as demographic information and the travel time of likely customers.
This reveals which locations will produce the most successful stores. Planners can then perform further analysis of online spending patterns in those areas, producing a smart map that highlights which physical locations will experience the greatest halo effect—with revenue predictions for each location.
Another form of AI-based trendspotting applies to the insurance industry. GIS technology can create a training data set of past accidents with details on location, time of day, and road conditions. A machine learning program analyses the data and indicates the probability of accidents on specific streets at specific times. The insurer can then advise customers on alternative routes to reduce their risk.
Insurers are also using a combination of AI and LI to speed relief to clients whose homes have been damaged by natural disasters. After training on large sets of images, an AI program learns to distinguish a damaged property from an undamaged property, allowing insurers to automate and accelerate the delivery of payment, which traditionally took days or weeks to complete.
Understanding Customers and Competition
Every executive takes pains to understand a brand’s customers; location intelligence strengthens that effort.
Mobile phones, combined with the world’s 30 billion IoT sensors, have created an avalanche of anonymized human movement data that helps retailers understand their customers better. Add psychographic and demographic data—aggregated at the group level, not by individuals—and the result is a bevy of information with useful truths about customers. But that data is often too vast to explore without machine learning.
To better understand how location intelligence adds context to machine learning, consider some of the questions executives ask when planning brick-and-mortar locations:
- How easy is it for someone in one area of the city to reach a particular store?
- How far will customers from other locations travel to visit a new store?
- To what degree is a store accessible by the people likely to be its customers?
- If the customers of one store are demographically distinct, where should the company place another store to attract similar customers?
- How do these calculations vary by time of day or day of the week?
In the pre-AI era, planners could comb through data to answer those questions, but that often took months. Machine learning algorithms instantly run these calculations and display results on GIS dashboards.
With a detailed understanding of customers, retailers can adjust the merchandise they carry and how they display it. At one sporting goods store, a robot scans RFID-tagged products on shelves throughout the day and creates an updated inventory map of the store. The robot’s machine learning technology notes patterns that help workers stock products based on demand. Meanwhile, stores that offer pick-up services—which have become ubiquitous during the COVID-19 outbreak and may remain popular afterward—are using location data to predict when a customer will arrive to retrieve an order—of coffee, groceries, electronics, or furniture.
Understanding customers also means understanding the competition’s customers. For instance, one AI-based program analyses aerial imagery and classifies the types of cars in a parking lot, revealing information about the demographic groups who patronize a particular store.
A similar brand of intelligence can come from analysis of much larger areas. An oil-and-gas company could discover exactly where its competitors are working, anywhere in the world, by using a location-aware machine learning program to spot drilling rigs, well pads, and site activity from satellite imagery.
Asset Management—in Less Time
With machine learning and location intelligence, a company can understand the real-time conditions and locations of its assets. One utility company offers a striking example of the dividends this can yield. Under innovative leadership, the company enlisted drones to monitor the condition of poles and transmission wires, taking LIDAR-based measurements along the length of its network.
This left specialists with the daunting task of reviewing those measurements manually. Instead, the company added AI to the mix. Analysts taught a machine learning program to detect the power lines and any intrusion—for instance, vegetation—on the lines’ safety corridor. The utility company’s machine learning program analysed 10 billion data points and accomplished, in short order, what the company estimated would have required 50,000 hours to do manually
Seeing Growth Opportunities before They Emerge
A retailer interested in opening stores in up-and-coming neighbourhoods might use a machine learning program to analyse aerial imagery for areas of new construction—detecting empty plots of land or objects such as cranes and tractors. Planners can then use location intelligence to map projected demographic changes in those areas and get ahead of an economic upswing.
Similar innovations are happening at companies large and small, with modern GIS technology that features built-in AI capabilities. Delivery companies, for instance, can use machine learning to analyse drivers’ routes and plan better ones based on real-time and historic traffic conditions. Rail companies can use remote sensing technology like LIDAR to detect track problems, while machine learning programs can sense conditions that will likely damage train wheels.
The value of location-powered AI is not merely in monitoring the current condition of assets, but in predicting what they will be.
Risk Measurement, Risk Management
Economist Avi Goldfarb says a reluctance to take risks creates untapped potential for a business. Machine learning’s predictive capabilities can lower the cost of risk, thereby unleashing that potential. The effect on a business can be transformative, Goldfarb told Harvard Business Review in 2018. Companies that integrate machine learning and location intelligence will have an even better sense of how to take measured risks.
Consider climate change. As Grant Mullins of Regions Financial Corporation noted in a recent WhereNext article, companies such as Regions are increasingly concerned about the connection between climate change and environmental, social, and governance (ESG) risk.
Floods, high winds, and rising temperatures and sea levels will affect road conditions and building integrity, eventually driving populations out of areas that become disconnected or uninhabitable. This will have a profound impact on business operations—affecting everything from a company’s office and retail locations to its supply chain and marketing practices.
AI-based programs can process this big data and create predictions of weather impacts in coming decades. GIS-based smart maps contextualize those predictions, allowing business leaders to preview coming years and see how climate change will affect specific business locations—including offices, stores, distribution centres, and infrastructure. In this way, machine learning and location intelligence provide executives a risk map that guides investment decisions.
Company leaders will increasingly discover how machine learning and location intelligence can guide the allocation of resources to minimize risk. An insurance company concerned about liability can use a GeoAI program to analyse weather history and topographic features and predict which homes might see an increased risk of flooding. An agribusiness can comb through millions of data points from soil samples to historical yield data and sales to determine how much of a certain crop to plant where.
AI and LI for Strategic Context
With smart maps that add context to AI-fueled insight, companies become better positioned to achieve strategic growth, strong customer engagement, efficient asset management, and more accurate risk assessment.
Amid the uncertainty stoked by population and climate changes, shifting customer expectations, and variable economic conditions, business leaders can count on technology to evolve, too. Those executives who stay informed, especially of advances in AI and location intelligence, stand to gain a competitive edge.
This article was originally published in the global edition of WhereNext

Omar Maher
Omar Maher is a machine learning specialist with more than a decade of experience in analytics and AI. He is director for artificial intelligence at Esri, working on the intersection of AI and location intelligence. Omar co-founded two tech startups that used machine learning extensively to provide smart user recommendations and personalized experiences, and has served as the analytics lead for other multinational companies.

NextTech: Mapping the Business Impact of Air Pollution
Air pollution is not only a health hazard, it's also bad for business. A new tool helps executives weigh its effects on market development.
More than ever, new IoT sensors and mapping technology are showing executives exactly how air pollution affects business—and it can be measured in the trillions of dollars.
The COVID-19 pandemic has had varying effects on air pollution. In many places, shutdown orders have throttled economic activity, causing emissions to drop. Meanwhile, the US EPA temporarily relaxed enforcement of polluting activities during the coronavirus outbreak, even as some areas report persistent poor air quality. And studies are beginning to connect poor air quality with higher death rates from COVID-19. Sometime in the near future, the COVID-19 upheaval will recede, leading to a resurgence in economic activity and a return to normal conditions. Before that time comes, it’s worth examining the cost of pollution.
The impact of poor air quality on the environment and human health is worrying enough: 4.2 million deaths a year occur as a result of exposure to outdoor air pollution, according to the World Health Organization (WHO). Urbanisation, a trend moving quickly through Asia and Africa, is accelerating the ill effects of air pollution, which can lead to lung cancer, strokes, and heart disease, among other maladies. Today, 80 percent of urban dwellers are exposed to pollutants that exceed the WHO’s guideline limits, with the highest concentrations in low- and middle-income areas.
Now, economists and data scientists are tracking the costs businesses sustain through disruption to employee health and consumer buying habits. The cost of air pollution in the form of work absence, premature deaths, and years lost from life reached $2.9 trillion in 2018, or about 3.3 percent of global GDP, according to the Centre for Research on Energy and Clean Air. Pollution’s effect on consumer spending is no less startling, with air quality likely influencing billions of dollars’ worth of transactions.
Such troubling metrics have led executives to use a geographic information system, or GIS, to track air pollution, which can vary as much as eight times within the span of a single city block. With location technology decision-makers gain a clearer understanding of where air quality could be hurting employees, customers, and the bottom line.
Article Snapshot: Studies show that high levels of air pollution suppress economic activity, as residents choose to stay indoors. A new mapping tool helps business planners understand the air quality index (AQI) in locations around the world.
Air Pollution in Market Analysis
Market development typically involves learning everything about a location—the elements that could impact business success and employee quality of life. That process is now expanding to include air quality considerations.
In the past, the focus has been on demographics of a city or region—learning about the people, their interests and purchasing habits, and whether the area is growing or stagnating. But with IoT sensors and technology like GIS, which displays layers of complex data on smart maps, executives can now also visualise how business health and sustainability may play out. Depending on the industry, air pollution could prove an essential factor in market assessment, on par with consumer brand affinity or access to transportation.
Being able to see the levels of air pollution in a given region, and how they differ from nearby areas, yields clear advantages for business leaders. Those levels can have a direct impact on business health. For example, researchers using GIS and statistical programming recently determined how consumer spending fluctuates in relation to levels of airborne pollutants. Their analysis of data from 12 Spanish provinces showed that consumers were spending $29 million to $48 million less on days when ozone pollution was 10 percent worse. Just a small reduction in ozone pollution and particulate matter pollution, the study found, would result in increased consumer spending of between $19 billion and $30 billion annually. Scale that beyond a dozen Spanish provinces and it’s not difficult to see the amount of business activity at stake.
Making the Invisible Visible
Through a GIS application that reveals worldwide air quality index (AQI) readings, a business executive can add context to decisions such as where to build a distribution centre, whether to enlist a new contract manufacturer, and when or where to open a pop-up store. From North America to East Asia, a user can zoom in on a particular region or type in an address and instantly see the AQI ratings.
This short video offers an example of what this NextTech might reveal.
Using this technology, executives can make up-to-date, informed decisions about areas with air pollution. They can protect the health of employees and economic vitality, or even lobby for improvement in places where the company maintains operations. And since pollution can vary dramatically within small areas, planners can add localised datasets to their analysis when it’s time for detailed planning. Monitoring levels of air pollution geographically, in conjunction with factors such as urbanisation, can give a company the edge in choosing the safest and most secure spots for business growth.
Powerful Tools for a Complex World
A recent study in the journal Nature underscores the need for tools that condense complex data into an intuitive visual form. The report shows how air pollution can literally be a moving target, travelling like weather across state lines.
Through GIS apps, executives can see simultaneous displays of complex data layers including AQI readings, historical patterns, weather, and IoT-generated real-time feeds. This level of location intelligence supports planning to keep employees, customers, and business operations healthy.
This article was originally published in the global edition of WhereNext.

How Businesses Are Bringing Clarity to Coronavirus Response
Business leaders can use location-specific data to guide their employees and customers amid coronavirus and COVID-19 uncertainty.
In a time of crisis, accurate data and quick insight are essential for a meaningful business response. As the novel coronavirus disease (COVID-19) spreads, companies are using location technology to help executives, employees, partners, and customers navigate effectively.
Business leaders are seeking clarity in a situation that changes hourly and varies widely across locations. Geographic information system (GIS) technology is helping them—and their employees and customers—understand the coronavirus reality and make decisions quickly.
COVID-19 Response Tactics
In the private sector, GIS professionals are quickly shifting their focus—from traditional projects like analysing customer demographics and assessing prospective store locations—to creating resource sites and applications that guide people through the COVID-19 outbreak.
This site equips GIS professionals with datasets and resources to build effective dashboards for navigating the pandemic. (Editor’s note: A business-focused version of this resource will go live soon. When it does we will update the links here.)
To manage uncertainty caused by coronavirus, GIS teams are using maps, dashboards, and other tactics to support executives, employees, customers, and the public:
- One global manufacturer created GIS-based dashboards that monitor the status of production facilities, distribution centres, and supply chain partners. This information helps decision-makers maneuver around disruptions and keep critical supplies flowing, much as it has in natural disasters.
- A US-based retailer quickly developed a GIS dashboard to guide its COVID-19 response. The dashboard is powered by a smart map and displayed on big screens in the corporate office, allowing executives to quickly view store openings, virus cases, and employee status. Executives use that insight to adjust resources and policies as circumstances change.
- A global bank is finding new ways to help customers access services. Bank analysts are using GIS to assess customer locations and drive times. With that insight, the website and mobile app can direct customers away from areas with higher COVID-19 incidence and toward services in safer locations.
- One of the largest retailers in the world is quickly building GIS apps for customers, the public, and health officials. These smart maps deliver intuitive views of store openings and closings, testing sites, emergency supplies, and more.
- A mid-sized tech firm with a global services division spun up a mobile app that allows its consultants to share their location and working status, creating a map for executives to see where and how many resources they have available to assist clients.
Other data layers an executive might map include state and local shelter-in-place orders, online sales orders and pickup locations, and optimal delivery routes.
Many of the above companies quickly deployed lightweight mobile apps for global facilities and offices. Regional managers use the apps to note the status of production, employee health, and other important metrics. That data is added in real time or near real time to smart maps at headquarters so the company can communicate status reports to customers and the public.
Finding Reliable Data During the Pandemic
Businesses, health officials, and governments are working together to address the public’s medical and everyday needs. That effort relies heavily on accurate data.
GIS acts as an information hub, connecting organisations to authoritative data sources and helping them make sense of their operations on a map. The Johns Hopkins map of COVID-19 cases, for instance, is built on GIS technology, and has been incorporated into business dashboards to bolster COVID-19 awareness.
GIS technology is also a platform for data sharing. At this GIS resource site (the same site mentioned earlier in this article) companies can connect to authoritative data sources, including:
- Healthcare facility locations
- The location and number of hospital beds
- Current count and location of COVID-19 cases
- Population demographics
- Social vulnerability by location
In addition, companies like Walmart have created public dashboards with information on store openings and closings. A GIS team can add these and other datasets to information sites. With that trusted information situated on a map, employees, customers, and the public can quickly find resources to help them through the crisis.
Most companies already use the GIS technology that powers these maps, apps, and resource sites. By asking GIS professionals to contextualise critical information on COVID-19, business leaders are seeing more clearly during these difficult times.
Additional Resources for COVID-19 Response
How Your GIS Department Can Respond to COVID-19 [via Esri]
Rethinking Business Resilience in the Midst of the Coronavirus Outbreak [via Forbes, Esri]
Supply Chain Recovery in Coronavirus Times [via McKinsey]
COVID-19 Learnings for Consumer Goods [via Cognizant]
9 Maps That Show Which Areas Could Be More Vulnerable to the COVID-19 Pandemic [via Fast Company]

The World Leader in Commercial Real Estate Tells a New Story
At real estate giant CBRE, an executive unlocked the potential of location intelligence, turning maps into stories that help close deals.
In 2015, a technology race among the biggest real estate firms was accelerating, with each striving to win business and serve clients using the latest digital technologies. Executives at CBRE, the world’s largest commercial real estate firm, looked around at the competition and realized they needed to take a major step forward on digital strategy—and do so quickly.
That was when CBRE set its sights on taking the lead in an industry-wide digital transformation. As part of its strategy, the company incorporated a geographic information system (GIS) more directly into its client work. CBRE created Dimension, a groundbreaking application that has enabled CBRE professionals to turn data into compelling visual stories, transforming how clients select office, retail, and industrial sites; recruit employees; and choose vendors and tenants. An agile, hyper-fast, high-tech platform, Dimension drew comparisons to a Ferrari from CBRE professionals. Now that the company had the platform, it needed a driver to navigate the new capability.
Into that role stepped Tahirah Mahan Thomas, a marketing executive who had already been with the company for nine years and was known for her relentless work ethic and charismatic leadership. When the company asked if she’d be willing to lead the project, she admitted she had hardly heard of GIS. But she leapt at the opportunity.
Under Mahan Thomas’s stewardship, Dimension has become one of the most powerful tools in the CBRE sales professionals’ kit. When using Dimension, win rates increase significantly, and brokers use the platform in client presentations more than any other technology save PowerPoint.
Mahan Thomas’s talent as a digital storyteller and versatile communicator helped drive adoption of the new technology. She showed how to pair the visual expressiveness of GIS-based maps with data-rich location insight to create narratives that speak to clients’ business needs.
Laura O’Brien—executive vice president of operational excellence at CBRE and a champion of Mahan Thomas’s work—sees that as a core component of the technology. “The fact that we can tell stories using Dimension enables our sales professionals to really dig deep with the people in front of them,” she says. “They can take clients on a visual journey of discovery, with interactive story maps. That’s the magic.”
Article Snapshot:
Once upon a Time in Ohio
Born in Columbus, Ohio, and raised in the suburbs outside Cleveland, Mahan Thomas knew from an early age that she was a natural storyteller with a knack for presentation.
“When I was a little girl, I used to make up ads,” she says. “I’d jump out of the shower and suds up my hair into an ice cream cone and make up shampoo commercials.”
That habit was in part a family inheritance, shaped by her upbringing. Her mother was an educator, working as a school psychologist and administrator, and her father spent his career in the radio broadcasting business. “My dad is a big storyteller. When we would be on road trips, he would make up stories and tell them to us. My uncles are big joke tellers.”
She graduated from Georgia State University, where she studied journalism and communications and earned a minor in marketing and theatre. Afterward, she hopped between Atlanta and Houston, joining CBRE in 2006.
The world of marketing suited her instantly. “My personality is very motivational, being a cheerleader,” Mahan Thomas says. “I like to talk. I like to present. I’m social. Marketing was a natural fit.”
Long before Dimension landed on her plate, she recognized that storytelling was at the core of the real estate business. While it is an industry powered by numbers—square footage, lease rates, ZIP codes—CBRE’s brokers needed narratives to engage clients’ imagination and help them see the future. By reaching people on an emotional level, she saw, you could figure out how to better serve them.
“Storytelling is a huge part of the human tradition,” she says. “Before we wrote, we sat around fires and told stories. It’s how we educate. It’s how we connect with other people. It’s how we learn.”

Tahirah Mahan Thomas and her CBRE colleagues incorporate storytelling into location planning.
Choosing a Digital Leader
Mahan Thomas was hand-picked to lead Dimension’s adoption by O’Brien, a senior executive, 28-year veteran of CBRE, and former broker herself. Following the pioneering work of Peter Patnaude, who began the GIS evolution at CBRE, O’Brien volunteered to integrate the new technology into the brokerage organization. At first, it seemed like a simple task. Nearly everything CBRE did began and ended with location, and the company’s US mapping centre already generated as many as 70,000 maps a year. Dimension appeared to be a fairly straightforward digital upgrade of what had traditionally been an analogue process.
But through her initial conversations with GIS specialists inside the company, O’Brien realized the task was more complex and that the platform had capabilities that went far beyond the PDF and paper maps the salesforce was then using. With GIS-powered location intelligence, companies could identify otherwise unseen patterns in data, and those patterns could strengthen site selection, reshape the mix of merchandise in retail stores, pinpoint up-and-coming neighbourhoods, and predict which combination of vendors would create maximum revenue in multi-unit buildings.
“That made me realize that what this needed was a special leader,” O’Brien says. “This wasn’t just our same old mapping centre hiring a few more people with new skills. We needed someone who was really willing to dig in and see the opportunity not just then, but for the future. That made me think to explore our marketing organization for someone who excelled at highly visual presentation modes and wasn’t afraid of trying new platforms.”
After hearing Mahan Thomas’s manager describe her as a visionary, O’Brien had a feeling she’d found the right person to lead Dimension. Just as important as Mahan Thomas’s marketing skills was her ability to be a servant leader. “She would listen to the need first, figure out how to serve, and do everything she could to knock it out of the park,” O’Brien says.
When O’Brien asked Mahan Thomas if she would take on the project in early 2016, the answer was an emphatic yes. But the new leader realized she had a lot of work ahead of her. She had heard the hype around Dimension, but the transformative potential that people kept talking about wasn’t clear to her. She thought it was just about dots on a map.
A Defining Factor
Organizations that lead their industries tend to score highly on location intelligence. Read this e-book to learn how organizations like Apple, John Deere, and the New York MTA support their missions with location intelligence.
A Mapping Paradigm Shift
The moment the power of Dimension clicked for Mahan Thomas was when Marko Haarma, the GIS director at CBRE, first showed her a commute-optimizer tool. Using data from a client that was considering relocating its headquarters, CBRE created an interactive map that let the company’s executives pick various locations and instantly see the average commute time, distance, and costs for their workforce to reach each site. What in the past would have required hours of work designing and printing dozens of paper maps could be accomplished in real time and changed on the fly, on a single screen.
“Up to that point, I was thinking, ‘How am I going to get people excited about this?’” Mahan Thomas says. “That was the moment where I was like, ‘Oh, my friends, we are about to make some magic here.’”
Working with O’Brien, Mahan Thomas devised a strategy for driving adoption of Dimension within the company. They began by working one-on-one and in small teams with the most forward-thinking brokers in the company’s retail and industrial sectors. As those early adopters started winning business through Dimension, demand grew within the departments and spread throughout the company.
O’Brien and Mahan Thomas also incorporated Dimension training into popular internal education programs to teach sales professionals how to weave a location story. The training walked them through the process of narrative building by posing questions such as, Who’s the client? What’s their challenge? What are they trying to do? What datasets can we build?
Mahan Thomas helped brokers bring location intelligence to life through storytelling. “The subject location is the main character and the surrounding data points are the supporting characters. They are working together to do something special, whether it’s solve a problem or create an opportunity.”
Unlocking Narratives with Psychographics
One of the best examples Mahan Thomas found for this approach came as the company was advising the owner of an outdoor, mixed-use shopping centre in Texas. The centre’s occupancy had declined and wasn’t producing the expected results. Through Dimension, CBRE was able to pull aggregated data and dig into the psychographics (a more psychologically nuanced form of demographics) to understand the centre’s average customer and their corresponding shopping behaviours. CBRE discovered that the centre was actually drawing a more diverse demographic, including shoppers who were willing to commute and interested in retail experiences that involved the whole family.
CBRE developed a new management strategy based on the data about who was coming and what they desired. That insight unlocked a host of creative solutions, including video-equipped, pet-friendly amenities; branded towels to dry off kids who went splashing in the fountains; and on-site concerts and yoga classes. Nine months later, the mall was 90 percent leased and the amount of time customers spent on the premises had jumped to 135 minutes from 97.
For Mahan Thomas, who often talks about real-estate advisory as an art and a science, this case exemplified the power of both—the secret sauce, as she calls it. The location intelligence that Dimension provided was grounded in science and data analysis, but what the company did with that insight—the breakthrough solutions that others might not have been imaginative enough to create—that was more art than science.
“We really encourage being creative, being problem solvers, not being afraid to look at things differently,” Mahan Thomas says. “Our sheer scale at CBRE provides a lot of opportunities to learn, grow, and get really creative. It’s that X factor you can’t replicate.”
A Company Culture Open to Innovation
While Mahan Thomas tends to think of herself as right-brained and creative, she’s also a stickler for details, immersing herself in the nitty-gritty of whatever subject she’s assigned to.
When she was appointed to work on Dimension, Haarma—who had seen other leaders come and go—was sceptical that real change would happen or that the GIS department’s full potential would be tapped. But in Mahan Thomas, he found a leader willing to get down into the trenches and wrestle with the problems that her team faced.
“She sat down with every employee, no matter how high or how low, all the way down to our entry-level logo-map maker,” Haarma says. “She spent time one-on-one with them to understand the ins and outs, the ups and downs—everything about them. Nobody had ever done that before.”
When the time came to allocate more resources for the department, Mahan Thomas drew on her knowledge of the team’s inner workings to make a bold ask to significantly grow the team. Haarma still remembers the multi-tab spreadsheet she created with a quantitative case for why CBRE needed the labour power to reach the company’s goals. In short order, they began the process of bringing on several new hires.
Through connecting with employees, amassing data into a compelling case, and overcoming odds, Mahan Thomas inspired those she worked with, creating internal momentum that helped drive Dimension’s adoption.
“Based on what I’ve seen from Tahirah, her ability to make change in the company is unrivalled,” Haarma says. “We had the creativity. We had the products. But we were lacking the ability to make change and convince the powers that be.”
It didn’t hurt, he speculates, that she was a natural centre of attention. “Tahirah is a huge personality,” Haarma says. “When she walks in a room wearing a bright orange dress, heads turn. But her clothes are dwarfed by her personality. People listen. People stop.”
Timeless Principles of Communication
CBRE’s digital transformation began with a sophisticated GIS platform and the desire to stay ahead of the competition. But executives soon found that in order to achieve the technology’s full potential, they needed great leaders with a human touch who could mold data science into narratives that spoke to the heart and mind. Putting location intelligence into the hands of gifted digital storytellers has helped the company remain at the top of its field, with over $20 billion in revenue last year.
For Mahan Thomas, who was promoted to vice president and head of CBRE Advisory Services Marketing (while still overseeing Dimension), the process affirmed that technological advances never supersede certain fundamental principles.
“Technology doesn’t necessarily replace old forms of communication,” she says. “We just have new tools to tell our story better.”
This article was originally published in the global edition of WhereNext.

2020: Six Predictions for a Shifting Business Climate
Business trends that will dominate 2020 and beyond begin with customer centricity, rely on automation, and produce better business strategies.
Business trend prediction can be notoriously difficult, but corporate leaders who pay close attention see signs of what’s to come. Here, we asked thought leaders to weigh in on the future of business and the role location intelligence will play in tomorrow’s shifts, from urbanization to AI-based automation, climate change to customer power.

Climate Change Stokes Business Change
Grant Mullins,
Vice President of Spatial Intelligence and Analytics,
Regions Financial Corp
Climate change isn’t just on the horizon, it’s affecting us today. And companies need to know how to deal with the changes it brings. The connection between climate change and ESG—environmental, social, and governance risk—will likely be the next major location-based challenge we’ll encounter here at Regions.
Our ability to quantify the risks of climate change—and tell a visual story about how the company is reducing and mitigating those risks—will be a major asset, especially as boards and shareholders become increasingly vocal about expectations for ESG.
Broadly speaking, location intelligence is becoming ingrained in our daily customer centric culture at Regions. Our understanding of consumer habits and patterns will continue to inform how we put our customers first. Location will play a role in everything we do for our customers, from how we market our products and services to how we respond to environmental, social, and governance risk.

Customers Set the Agenda
Marianna Kantor,
Chief Marketing Officer,
Esri
In recent years, customers have come to understand their own deep influence over companies’ strategic agendas. In the years to come, businesses that make customer experience (CX) a top priority will thrive. Influential executives are taking a holistic view of how customers interact with their brand—understanding that it encompasses every type of engagement including marketing, point-of-sale, service, and support.
To better understand customers, industry innovators will leverage new, anonymized data on consumer behaviour. And since the vast majority of that data will be tied to specific locations, savvy executives will use location technology to analyse and understand customer preferences. The most influential CX trend in the next few years will be a focus on what customers want and where they want it.

Predictions Improve
Jay Theodore, Chief Technology Officer,
Enterprise Technology Group,
Esri
If we want to predict the future of business, we should focus on the future of prediction. Every company wants to know what’s ahead, adjust accordingly, and get an edge on the competition. The shrewd ones will take full advantage of predictive artificial intelligence applications, including machine learning and deep learning. This represents the next stage of digital transformation for many companies.
We’ve seen executives across industries embrace AI as a way to understand the state of their operations. In some cases that means analyzing call centre logs to identify which service complaints are common in which locations. In others, it’s using AI to perform image analysis on competitor locations or far-flung company assets. And they’re not just doing it once; they’re automating the process, scaling the operations, and letting the model learn and improve future predictions.
What only a select group of executives grasp—but more soon will—is AI’s ability to analyse this and other data to see what the future holds for a business. One of the most compelling business cases in the next few years will involve predicting how much revenue a new store will generate in a specific location. This convergence of AI and location intelligence will help bricks-and-sticks companies and digital upstarts plan growth strategies more precisely, and minimize risk in the process.

Demand Grows for Sustainable Choices
Lindsey McDougall,
Electric Vehicle Program Manager,
Austin Energy
As sustainability becomes a mainstream concern, interest in electric vehicles will grow. Businesses with a role in filling that demand will create ways to serve new and existing customers.
At Austin Energy, we are working to identify underserved populations for electric vehicle charging stations powered by renewable energy—including low- to moderate-income communities and areas without adequate access to them. Once we identify those areas, we will customize our programs and outreach to those residents by using location-specific demographics and other data.
We will also enhance our demand response programs by analyzing vehicle telematics to better understand the demand for electric vehicle charging. And we will prioritize charging station maintenance and station upgrades based on location and usage analytics.

Adapting to Urban Growth
Cindy Elliott,
Commercial Industry Lead,
Esri
Increasing urbanization will play a substantial role in shaping business strategy. More than half of the world’s population lives in urban areas, and in just three decades that proportion will reach nearly 70 percent. In raw numbers, that’s an additional 2.5 billion people calling cities their home—and nearly 90 percent of this growth will be in Asia and Africa.
We already see smart companies anticipating this trend. Nike, for example, has said that over the coming years, 12 cities—all but two outside the US—will account for 80 percent of the company’s growth.
To understand and leverage this demographic shift, businesses will use location intelligence to tailor strategies for specific cities. For example, rather than a US business plan or even a Southwest regional plan, they’ll adopt a Dallas strategy or an Amsterdam strategy. This kind of local planning will require a detailed understanding of how consumer preferences vary from city to city.
Those same businesses are also facing pressure to compete with Amazon and the “right now” economy and stay mindful of their environmental impact. This means they’ll have to figure out how to get products and services to their customers today—or even within the hour—with fewer emissions. Location intelligence will help companies address these tactical problems and inform larger strategies for an urbanizing world.
Automating Business with AI
Omar Maher,
Director of Artificial Intelligence,
Esri
If we’re predicting the future of business operations and strategy, two terms come to mind: artificial intelligence and automation. Advances in machine learning and deep learning are making it possible for AI to process thousands of variables to make predictions, as well as extract insights from complex data such as imagery, video, and text. And all these processes can be automated.
What companies will discover is that automation, combined with location intelligence, can provide unprecedented levels of insight. For instance, by leveraging the exploding amount of human movement data available, businesses can understand the character of cities and neighbourhoods with new levels of specificity. They can then use that knowledge, along with thousands of variables, to make accurate predictions regarding the best areas to open stores, craft effective marketing campaigns, and even choose the optimal product assortment or promotions for a given area.
Automation will also simplify the analysis companies routinely perform—and help them scale that insight quickly. One utility company that used a location-based AI model to analyse lidar data, as well as automate asset detection and extraction, saved 50,000 hours annually. Oil and gas companies, fast-casual restaurants, agricultural firms, and others are beginning to understand their competition by automating AI-based programs that sift through thousands of satellite images of specific facilities and locations. These pioneers will achieve and enjoy a competitive edge for years to come.
This article was originally published in the global edition of WhereNext.

What Generation Z Wants from Work, Where
Buffeted by political and economic turmoil, the next wave of engineers and business professionals seek job stability with a domestic focus.
u
A new survey of business and engineering students and their employer preferences offers vital insights on the next wave of the global labour force. By assessing the survey data country by country, corporate leaders can divine trends that give them a competitive edge in recruiting the best talent in locations around the world.
In one of the biggest takeaways, the 2019 Universum World’s Most Attractive Employers survey found that job security rates as the highest priority among new graduates, contradicting assumptions that Generation Z shares the Millennial reputation for job-hopping.
Also, where students once prized international careers, uncertain economic conditions seem to have prompted young workers to stay home, whether in China or the U.S. By taking these and other Gen Z preferences into account, company leaders can tailor strategies to specific geographies as they market themselves to tomorrow’s workforce.
Article Snapshot:
The Desire for Future-Proof Employment
The study, which surveyed 247,235 business, engineering, and IT students in the Americas, Europe, India, Russia, and Asia, found a “decade-high percentage” of students favouring employment security. Trade wars, tariffs, and political and economic change have led students in the world’s twelve largest economies to seek so-called “future-proof” jobs which can withstand economic flux.
Hand-in-hand with this mindset is a marked preference for working in the country of one’s origin—a trend especially notable in China. That was one of the biggest changes in Gen Z preferences in recent years; in 2019 just 27 percent prized an international career, compared with 32 percent in 2016. This finding is backed up by broader trends: an article in The Economist reported that in 8 out of 10 sectors, multinational companies are growing at a slower rate than domestic companies.
When Universum conducted its study 10 years ago, 5 of the top 10 companies favoured by Chinese students were Chinese brands. In 2019, that number grew to eight. The top five preferred employers for Chinese students are all Chinese companies, and multinational tech giants like Microsoft and Google have fallen off the top 10 list entirely.
Companies that once marketed international careers as an advantage may now want to advertise opportunities for education and growth within the domestic business.
Locational Variance—How Countries Differed on Work Priorities
In 10 of the 12 countries surveyed, business students ranked work-life balance as their top preference. Having a secure, stable job generally ranked second, while being a leader or manager of people was the third priority.
But in Mexico, for instance, this trend was nearly reversed. Gen Z students reported leadership as most important, with security and stability third, suggesting a rising class of workers with managerial aspirations who aren’t afraid of risk.
Russia was the other notable outlier. There, students named stability as the number one priority. Their second-highest priority: being competitively or intellectually challenged—a fact which companies seeking to hire in Russia could address in marketing materials.
Engineering and IT students largely broke down along the same lines as business students on the first two priorities, but their third-most important interest proved more diverse geographically. Being entrepreneurial or creative/innovative ranked third for up-and-coming professionals in Brazil, China, and Germany. South Korea was the only country to include autonomy and independence among their top three job preferences, while India was the sole nation to select being a technical or functional expert and having an international career as top priorities.
A Location-Savvy Recruiting Strategy
Whether companies are working to recruit international talent or homegrown employees, location-based insights can be the difference maker in finding the best-suited job applicants. That application of location intelligence can drive HR strategy, which in turn drives business performance.
In one example, the chocolate company Hershey, facing slowing growth in its traditional markets, predicted new customer opportunities in the emerging urban middle class of the Middle East and Asia. After studying the local demographics, company planners located a young, productive workforce near the city of Johor, Malaysia. A deeper analysis of the psychographics of the labour pool helped the company tailor the facility’s layout and operations to employee preferences for language, religious practices, and job training.
It’s another example of how incorporating location-based data—whether on the latest employment preference survey or shifting demographics—can help companies arm themselves with the best talent for the future.
This article was originally published in the global edition of WhereNext.