Blog Archives
NextTech: Artificial Intelligence in Action for Business
Once the province of a privileged few, artificial intelligence and location intelligence tech are in play today across many business scenarios.
Inside the skunkworks of the Fortune 1000, data scientists are using artificial intelligence and location intelligence to change the very nature of business. In the decade ahead, these two technologies will transform the way businesses devise strategy, analyse competitors, and engage customers.
Artificial intelligence (AI), perhaps the most-discussed tech innovation in recent years, shows nearly boundless potential, yet stokes trepidation among some business executives. Best viewed as a basket of capabilities ranging from pattern recognition to behavioural interaction to prediction, AI augments a company’s ability to spot trends and make quick, informed decisions.
Location intelligence brings context to AI’s findings—grounding data in time and place. Location intelligence shifts AI from the realm of science into the practical world of business strategy. In this NextTech, we’ll investigate how companies are using AI and LI to assess long-term investments and manage customer expectations in real time.
(Explore this e-book for a closer look at AI’s business use cases.)
Article Snapshot:
Business executives have long relied on AI’s ability to detect objects in images. Now they’re using location intelligence as a companion technology to uncover additional data.
Hedge funds catalyzed an imaging space race, paying top dollar for satellite photos that revealed how many customers were visiting major retailers, for instance, or how much activity global ports experienced from week to week. With that information, investors made millions on stocks and other securities.
Now that imagery is more accessible and technologies like AI and geographic information systems (GIS) are mainstream, commercial companies have joined the quest for deeper knowledge, with some running well ahead of the pack.
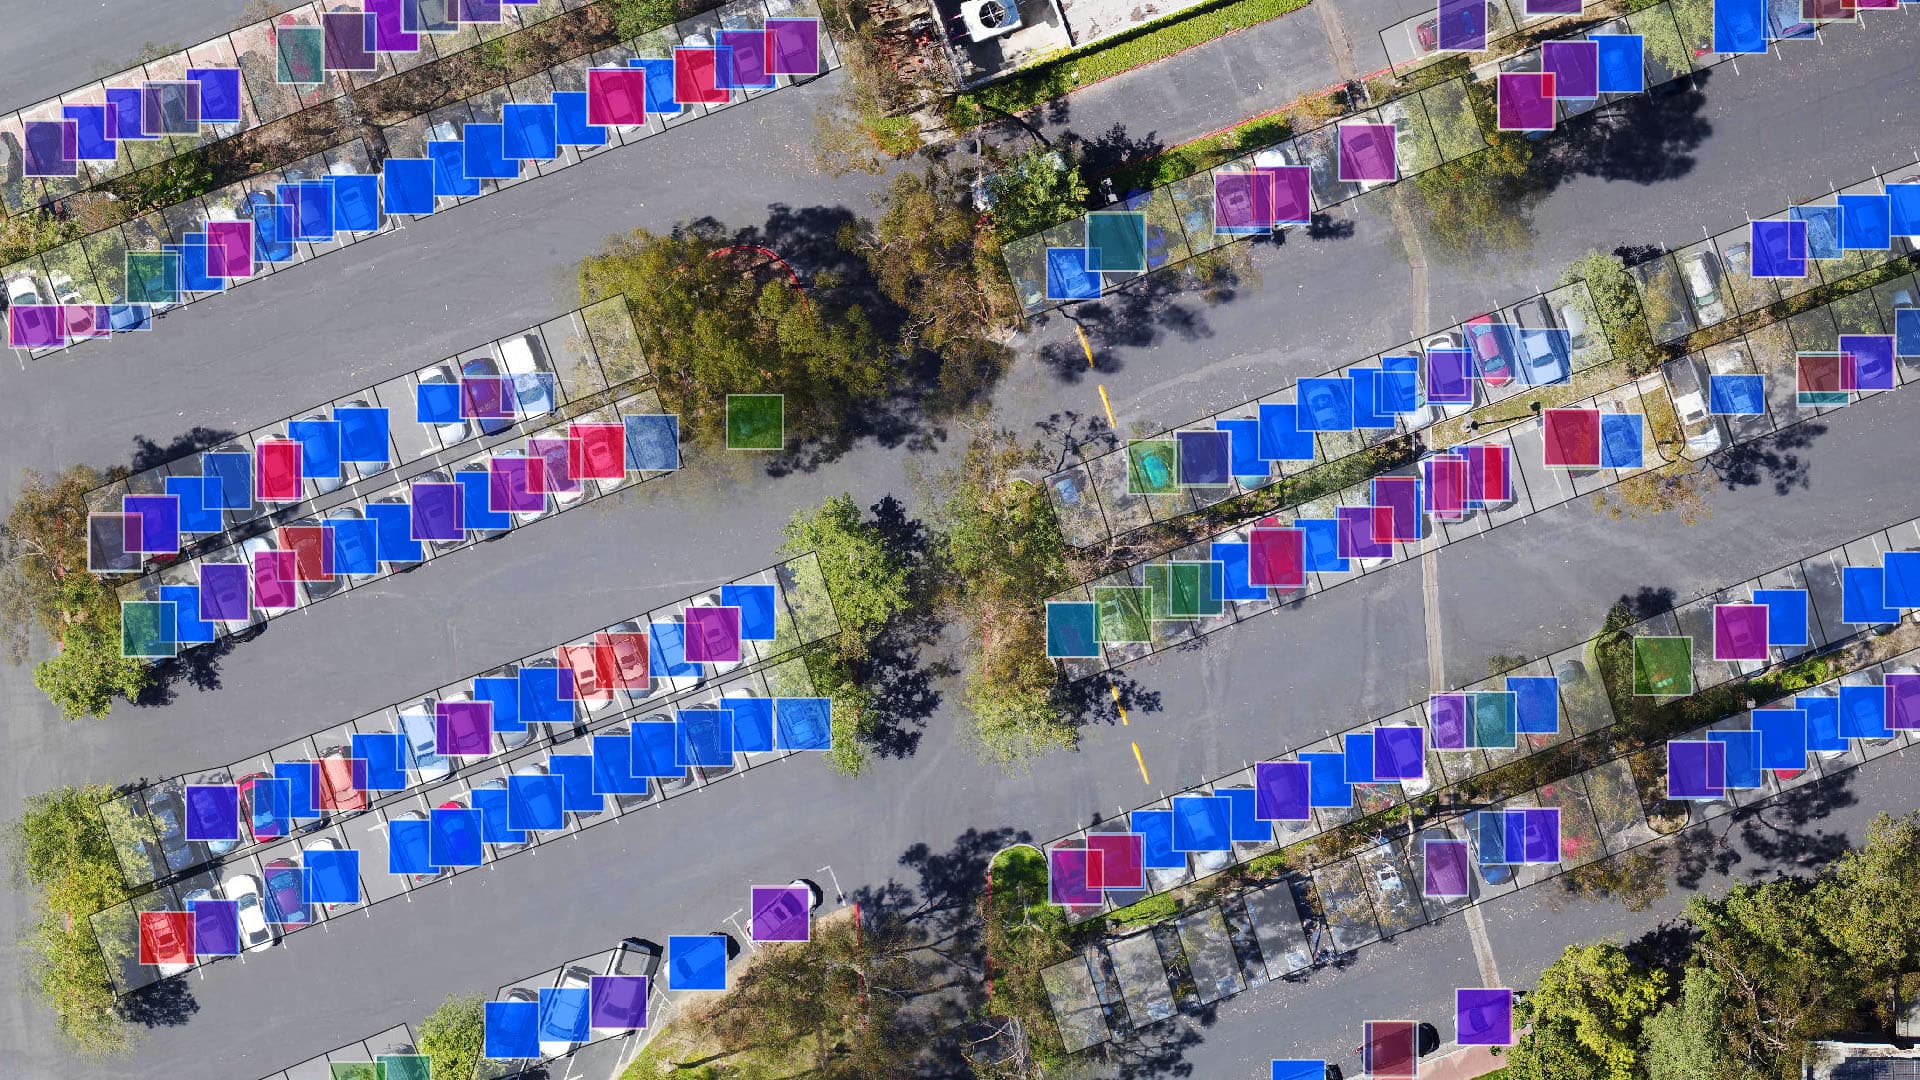
One use case—the analysis of parking lots—has evolved from tabulation to extrapolation. Business planners no longer simply count cars to gauge the suitability of a business location or to monitor a competitor’s performance. Now they analyse who those shoppers might be—all with the help of AI and location intelligence.
The dashboard below shows a simplified view of this work. The AI model has separated sedans from pickups and other kinds of vehicles—factors that can be used to infer the demographics of shoppers and understand the habits of those groups, without using personally identifiable information.
GIS adds the context of location and time, allowing companies to monitor how visitor traffic fluctuates throughout the day, exposing insight that can influence staffing, promotional campaigns, and more.

Some skunkworks teams are getting more granular as they plan business operations. In certain cases, executives and data scientists are gauging customer satisfaction through drive-offs. That happens when a would-be customer encounters a crowded parking lot or a long drive-through line and decides to take their appetite and business elsewhere.
With many businesses creating drone imagery of their own and satellite companies on the verge of supplying high-resolution imagery at 20-minute intervals, hedge funds no longer have privileged access to overhead intelligence.
Planning Investments with Deep Learning and What-If Scenarios
Ironically, in a digital economy, the physical connection between business and customer may be more important than ever. Consumers expect the speed of digital transactions to be mirrored in the physical world, with products and services delivered quickly and available for pickup in near real time. Executives who plan stores, restaurants, warehouses, and product pickup centres stand to gain from creative use of AI and location intelligence.
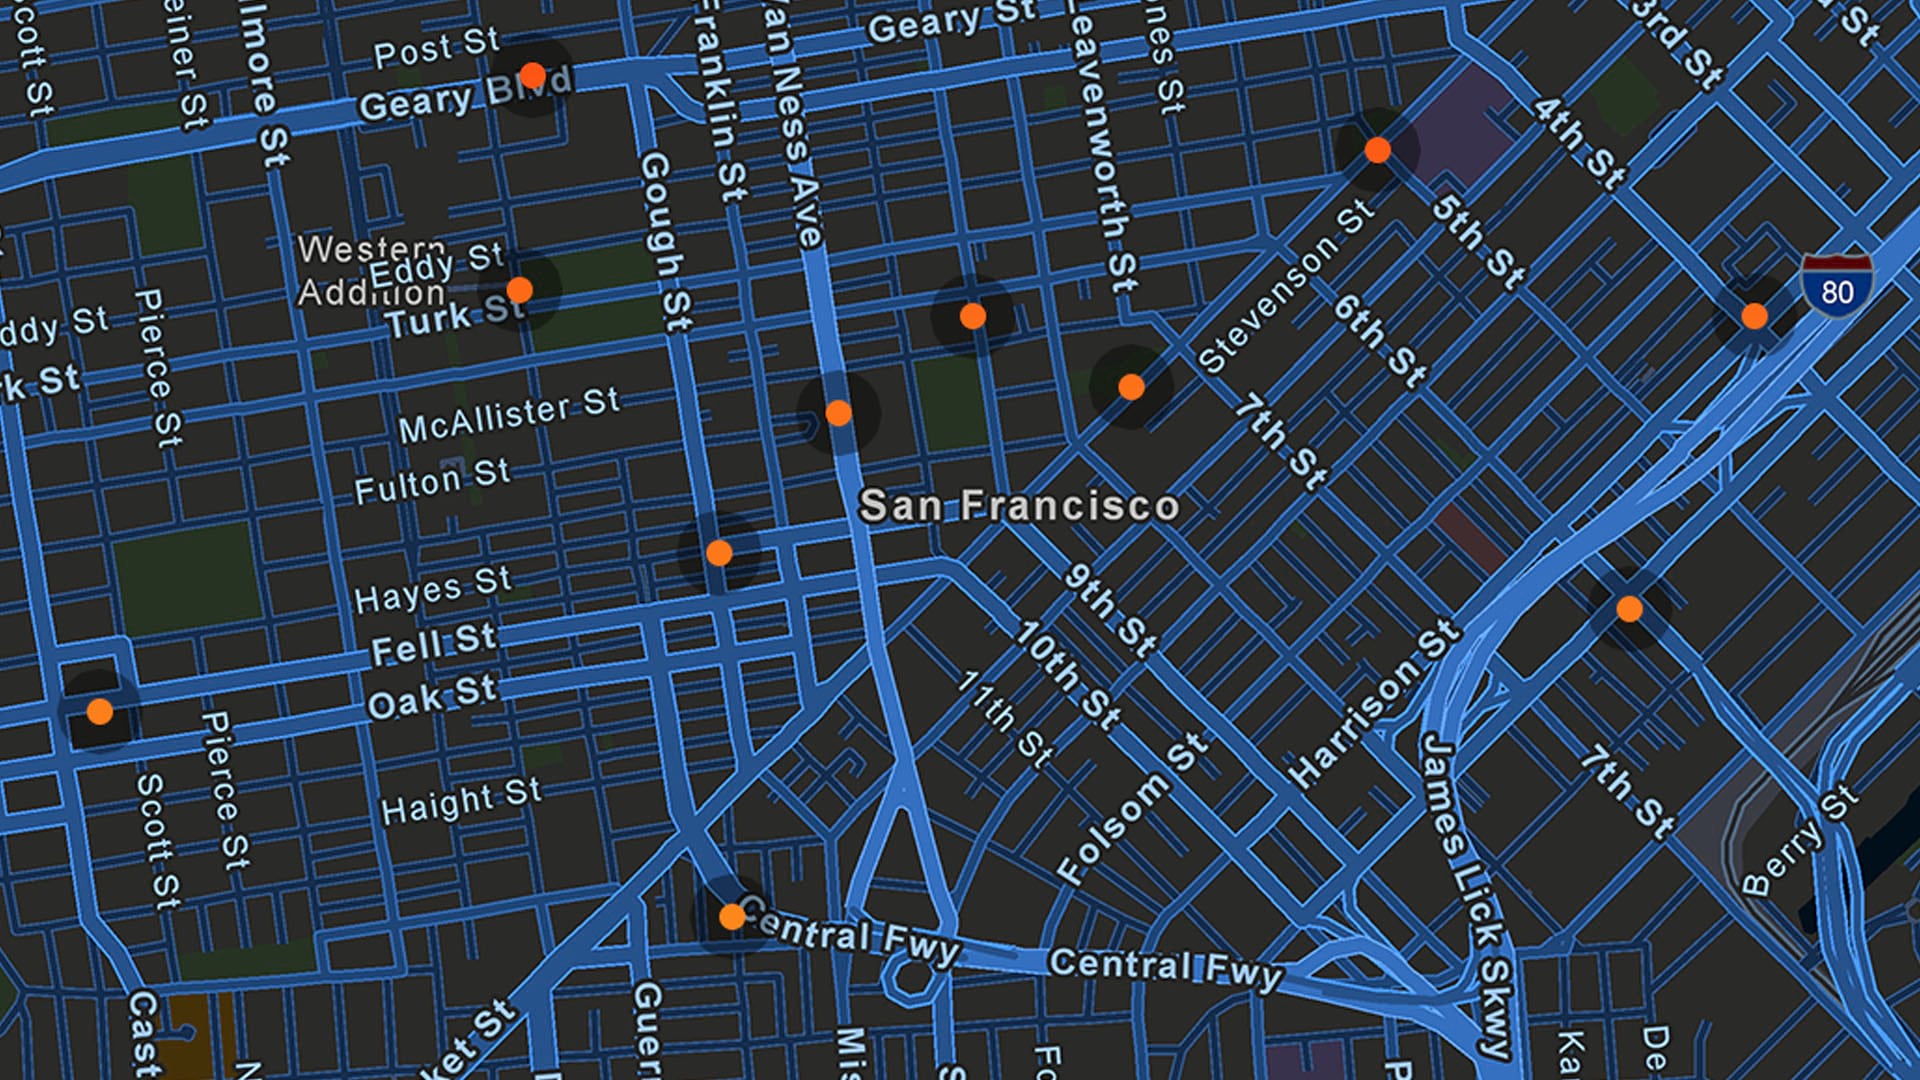
In one example featured in the video below, a deep learning model makes more than 32,000 calculations in less than a second to reveal how accessible business locations are to thousands of customers. The analysis calculates several important factors, including the time it would take for someone to reach the business, as well as the demographics of the area where that person lives.
Conducting such a complex analysis on the fly is only possible through big data computing, deep learning algorithms, and location intelligence technology. A modern GIS specializes in such scenarios.
In the video below, Esri’s Witt Matthot explains how this form of business planning plays out.
Managing Customer Expectations in Real Time
When planning a business built on customer interaction—whether that’s a customer visiting a store or a business delivering goods and services to the customer—efficiency directly impacts customer loyalty and profits.
More than half of consumers say they’ll switch to another retailer if it offers quicker delivery, according to a 2019 Capgemini report. Twenty percent say they’ll abandon a brand if delivery service is not provided.
That’s why visibility into the delivery chain is crucial for customer-facing businesses.
In the video, customers are heading to a store to pick up orders—that might be coffee, a trunk’s worth of groceries, or the latest fitness tracker. With a dashboard of their real-time locations, the business can manage its operations effectively, ensuring that imminent arrivals get expedited orders and slower movers are queued up for later fulfilment.
The same capability can work just as effectively in reverse. For instance, an operations centre might use a similar dashboard to track employees making dinner deliveries, or field technicians heading to service calls. At the heart of that real-time view is an intelligent location engine boosted by AI, making complex calculations easy to understand.
Imagine a dashboard that tracks drone deliveries instead of people. That level of customer interaction is already upon us, and savvy executives are using it for business advantage. As customer interactions change, the technology to plan and manage those interactions is evolving too, providing the insight and location intelligence needed to make profitable decisions.
This article was originally published in the global edition of WhereNext.
The Privacy Paradox: How Companies Gain Consumer Confidence in Data Sharing
A new study illuminates why companies must win consumer trust when it comes to data sharing—and where in the world trust is highest.
A paradox lies at the heart of consumer attitudes toward data sharing, according to a recent study containing important insights for business executives who shape data-driven strategies. In a survey of more than 10,000 respondents across 10 countries, HERE Technologies found consumers as anxious as ever about potential data abuses, with 53 percent reporting concern about sharing personal information digitally, up two points from 2018.
Yet more than two-thirds of consumers, or 70 percent, signalled a growing willingness to share location data, a metric that rose in every country surveyed except Germany. The openness to sharing is more common for services related to mobility, like ride-share apps, connected cars, and mapping platforms.
A close parsing of the study’s findings reveals a clear path forward for organizations that employ business and location intelligence to inform decision-making: companies stand a much better chance of accessing and deriving value from data when they are transparent, trusted, and demonstrate benefit to the consumer.
With the usefulness of location data being well-established in finding and mastering new markets, companies in retail, insurance, banking, and other industries do stand to gain, but must allay customer worries about how their data is used.
Article Snapshot:
Location Data Has Never Been More Important—or Sensitive
Concerns about data privacy have been top of mind in recent years. One cybersecurity report found that within just the first six months of 2019, over 3,800 breaches exposed access to more than 4.1 billion records. Massive data breaches like Yahoo’s hacked user accounts and Marriott’s compromised reservation system continue to capture headlines. Meanwhile, new regulatory regimes like the European’s Union’s General Data Protection Regulation and the California Consumer Privacy Act have made data privacy a political issue. In general, consumers are simply more aware of how coveted their data can be, with 48 percent agreeing that their data is valuable to many collectors, according to the HERE study.
These facts have prompted companies to more carefully address communication and transparency around the use of consumer location data. At the same time, the speed of the information economy has made location intelligence a linchpin of market planning and competitive advantage. As noted in a Forbes piece on the topic, “the McKinsey Global Institute indicate[s] that data-driven organizations are 23 times more likely to acquire customers, six times as likely to retain those customers, and 19 times as likely to be profitable as a result.”
Location data—gleaned from smartphones, social media, IoT-equipped devices like fitness trackers, even dating apps—can be immensely beneficial to companies planning growth strategies. Plotting out movement trends on maps over time, executives can create location intelligence that reveals where certain groups of consumers are now and, more significantly, where they’re likely to be in the future.
Myles Sutherland, founder of the consulting firm One Degree North, has coined a term for these moving masses of location data points: human weather. “Imagine being able to track the patterns and impact of human activity like a meteorologist tracks weather fronts,” wrote business development strategist Jim Young in an article on the topic. This kind of insight could be invaluable to a retailer assessing the foot and car traffic near potential new sites, a restaurant chain determining whether to add a new late-night menu, or a real estate developer looking to acquire buildings in the next hip neighborhood. The powerful ways companies can leverage this kind of data underscores why organizations must assure consumers that their information is not being misused.
How Attitudes toward Data Use Are Shifting
Trends in data sharing vary by region—a notable fact for companies with an international presence. The HERE study found that data sharing was highest in China, with 90 percent willing to share, followed by India, Brazil, and the UK. The United States, where many data-sharing apps have originated, actually landed in the middle of the pack, with 71 percent agreeing to share location data. Japan, Germany, and France reported the lowest levels of trust and frequency in data sharing. The biggest rise in sharing frequency occurred in Brazil, up seven points from 2018.
Still, despite consumer reservations, openness to sharing location data is fairly common across the board, according to the study. That willingness rose sharply when doing so was seen as necessary or working to the consumer’s benefit, with 75 percent of respondents more apt to share location data when it contributed to safety or security. Enabling a service, saving money, gaining financial rewards, saving time, or increasing convenience were among the other top motivations that led to greater consumer tolerance for opening up their data.
Not surprisingly, six out of 10 consumers were more likely to share data when the collector was well-known. And a full 79 percent reported being likely or very likely to allow navigation or mapping services to access their data. This helps explain why public transportation and ride-hailing services saw the greatest gains in consumer trust, as did car manufacturers, with more consumers linking their phones to their vehicles. In these cases, the consumer saw clear value in sharing data, and the collector was an established brand or company whose reputation assuaged privacy concerns.
For business executives, these findings signal a blueprint for creating a data-sharing understanding with consumers. By creating trust, emphasizing transparency, and showing how location data will play to the consumer’s advantage as well as the company’s, business leaders can use that data to accelerate growth and bring key customers along with them.
(Find out more about how companies use market and customer analysis to expand.)
This article was originally published in the global edition of WhereNext.
NextTech: Retailers Combine CRM and GIS to Understand Customers
CRM technology helps companies organize information on customers; GIS software helps them discover and share insight.
It’s an open secret in today’s retail environment: Unified commerce is as much about data as it is about shopping.
Best in class retailers are taking a hands-on approach to customer data—seeing it not just for what it is, but for what it becomes when combined with other data assets. These companies are integrating consumer insight with location data to discover new insight on where and how people shop.
In this NextTech instalment, we’ll explore a burgeoning trend that combines two established technologies to deliver competitive advantage.
Article Snapshot:
Omnichannel, Fuelled by Data
The promises and perils of omnichannel retail are well documented. Executives have read enough incendiary headlines to feel the breath of change on their necks. Many came of age during a time of retail predictability and growth, and now face customers unsatisfied with traditional shopping and delivery methods.
Retailers who have adapted to this new model—or are progressing toward successful adoption—have more to thank than good instincts and innovative teams. Invariably, they have the tools and techniques to make use of their data.
Some, for instance, have segmented their customer base into core shopper profiles and are catering to where and how each segment likes to shop. Others have used location data and artificial intelligence to pinpoint the dollar value a physical store contributes to online sales in that geographic region—an important factor in predicting future revenue.
These insights emerge from the nexus of two technologies that have been key to retail success, but often exist separately: customer relationship management (CRM) and geographic information system (GIS) software.
The videos below offer a window into how a retail executive might use these two technologies to gain a competitive edge.
Omnichannel Retail Evolves into Unified Commerce
Learn how leading retail executives are evolving from omnichannel to unified commerce with the help of AI and other advanced technologies.
McKinsey and the Growth Potential of Geospatial Analysis
In a July 2018 article, a group of McKinsey consultants offered their view on the value of data in retail. Their central message was that with geospatial analytics, companies can quantify the bottom-line value of their stores across channels.
As the authors note, companies enjoy varying levels of access to customer data, and some will need to partner with third-party companies to fill information gaps. But regardless of how they access the data, companies that analyse it with geospatial technology tend to realize early wins and surface growth opportunities within a year, according to the McKinsey team.
As it turns out, geography remains an essential business consideration, even in an omnichannel world fuelled by digital connections.
NextTech: Combining Two Data Sources
The discovery process for omnichannel retailers—and those aspiring to omnichannel status—often begins with CRM, the database that houses customer addresses and purchase histories. As innovative companies have discovered, GIS provides the analytical power to bring customer data to life for retail executives and decision makers.
In this video, a hypothetical national retailer is visualizing where customers live and which shopping channels they prefer to use.
A regional manager might use this CRM-GIS analysis to examine omnichannel trends in their region and adjust merchandizing and marketing to better suit certain consumer habits.
For deeper insight, a retail executive will use the AI capabilities within GIS to spot sales trends—areas where online or in-store sales are heating up or cooling off. This video shows what happens when CRM data on channel preferences is cross-referenced with data on customer spending.
The Payoff: Smarter Channels to the Customer
The findings of recent studies suggest that omnichannel leaders are capturing more than just mindshare from today’s consumers. When the retail trade association ICSC analyzed $31 billion in consumer credit card transactions from 2016 to 2018, its analysts found that a shopper who spends $100 online typically spends an additional $171 in store within the next 30 days. Similarly, a consumer who spends $100 in store will spend approximately $163 online during the following month.
For many retail executives, capturing that spend is the greatest challenge on their agenda. In an omnichannel economy rich with data, the analysts who combine technologies to uncover customer insight will set the standard for success.
This article was originally published in the global edition of WhereNext.
NextTech: Visualizing Consumer Traffic
Using a modern version of a centuries-old technique, planners can study anonymized IoT data to see patterns of human movement.
A type of infographic used to depict Napoleon’s disastrous invasion of Russia is today helping corporate executives understand how and where people move.
In an unusual juxtaposition of old and new, the 150-year-old flow map is enjoying a business awakening in the age of digital transformation and smarter, faster decisions.
Article Snapshot:
Unlike many of today’s business tools, the flow map originated in the 19th century, invented by a French civil engineer named Charles Minard who created what has become an iconic map of Napoleon’s 1812 incursion into Russia. In stark shapes and lines, it depicts where the French troops travelled and how many of them succumbed to battle, weather, and illness during the army’s advance and retreat.
Like most useful information tools, Minard’s map offers a wealth of insight at a glance. Now, busy executives are repurposing the medium of flow maps to explore decidedly lighter topics—including consumer habits and how to connect with customers.

The process of analyzing human movement has undergone a digital transformation, and modern location intelligence technology is now making that insight ever more precise.
A New Use for a New Age
The implications for this form of visualization can be significant, and they stretch across sectors—from retailers to corporate office planners to out-of-home advertisers.
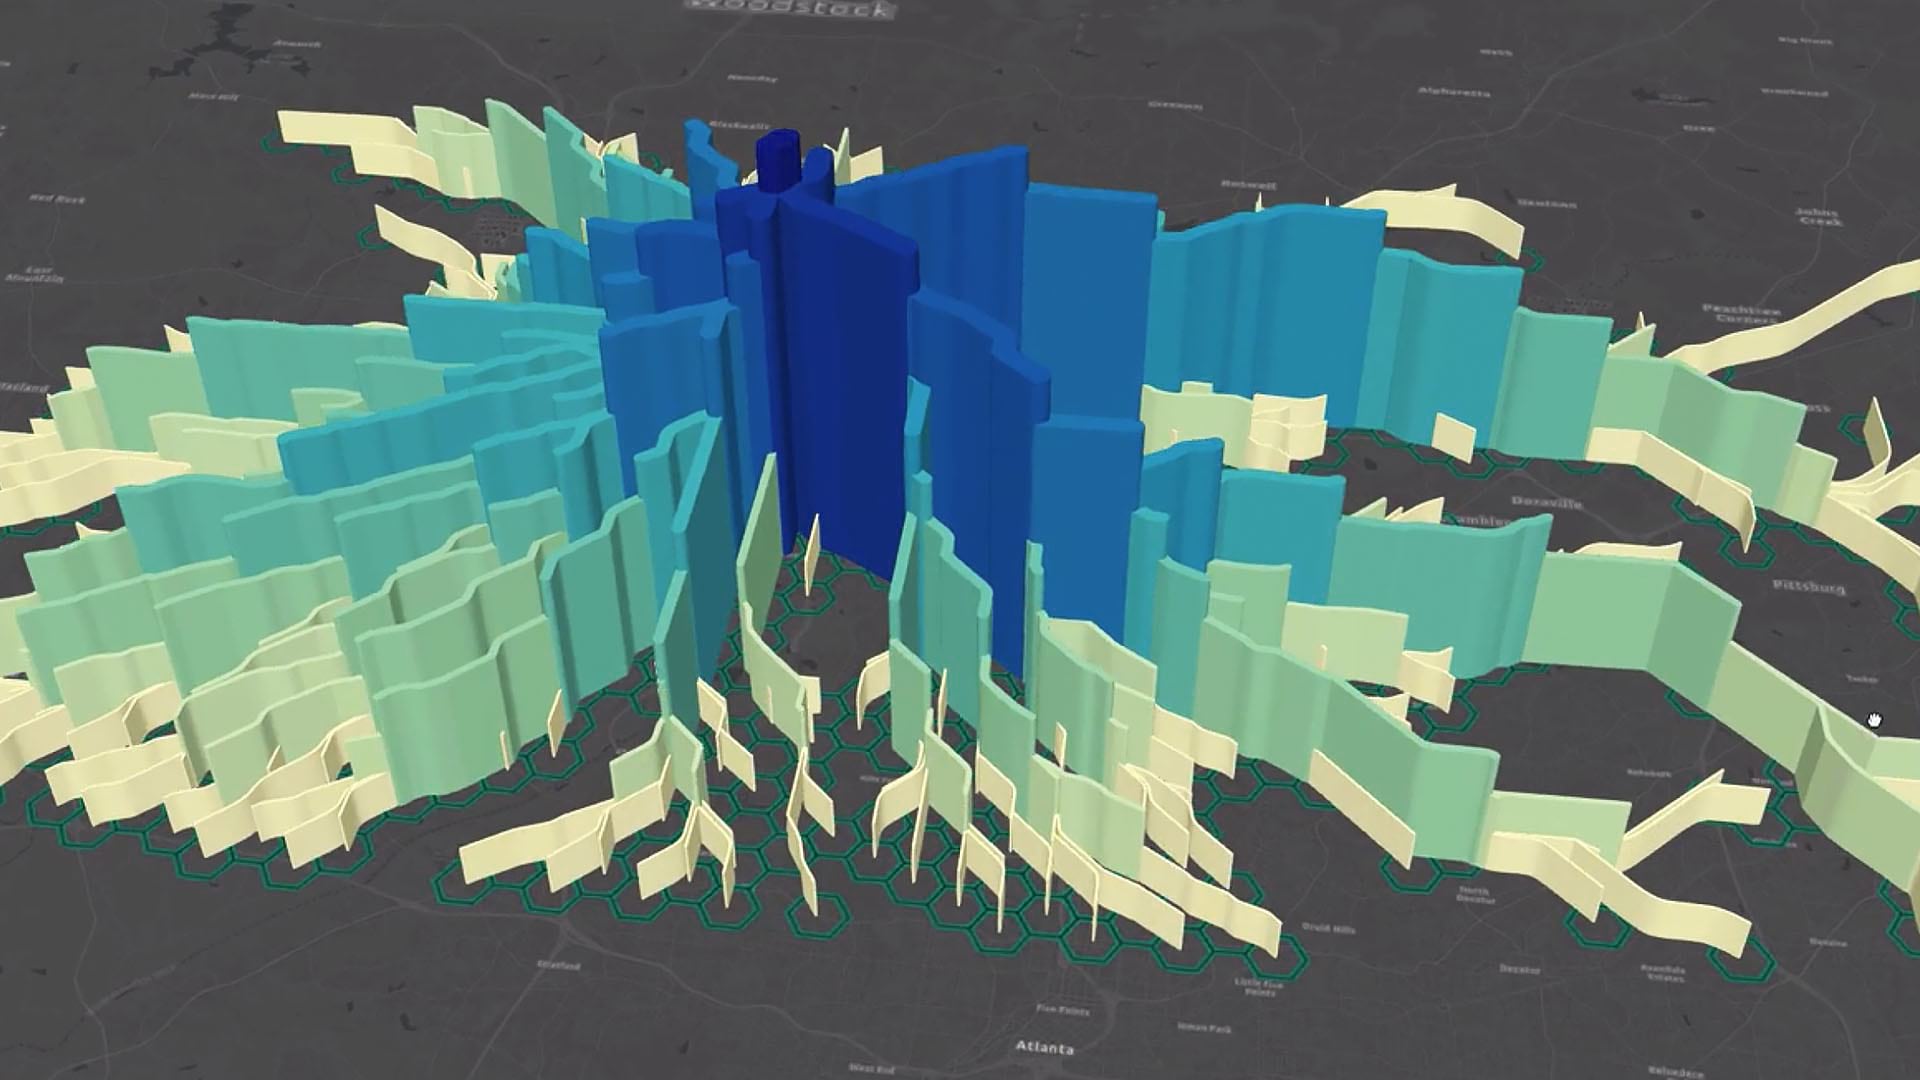
Here’s a look at what a modern-day flow map looks like, in a 14-second animation:
What it shows is the human equivalent of tracking rainfall through a river system. As more people use a given road, the height of the spine on the map grows. Feeder streams connect to tributaries, which empty into arteries, which lead to a destination—in this case, a mall.
The destination could be any place. For example, a clicks-to-bricks retailer might examine several empty storefronts to see how much traffic each attracts at certain times of the day. Likewise, a corporate real estate planner might examine a new office park to see how traffic flows during rush hour, and where professionals go for lunch.
This brand of location intelligence drives capital investments and strategic decisions across the business world today. [For a look at how leading companies like Apple use location intelligence, read this e-Book.]
Drawing Data from the IoT
The data comes from the Internet of Things (IoT)—connected devices like cars, phones, and fitness trackers. Instead of identifying individuals, IoT data is anonymized to create a broad picture of where people move.
Powering this NextTech is a geographic information system (GIS), the software that understands where people are moving within geographic areas and connects that movement to points on a map.
Esri’s Jim Young calls this movement human weather. He wrote:
Just as businesses benefit from traditional weather information—by routing supplies around natural disasters, positioning field crews to mend damaged infrastructure, and even predicting how a heat wave might affect sales—a broad range of business activities can benefit from data on human weather.
The marketing industry, particularly out-of-home (OOH) advertising, already benefits greatly from human weather data. But as Charles Minard proved more than a century ago, some pictures tell a story more readily than others. Placing human weather data on a modern-day flow map like the one in the animation reveals at a glance how people move through the built environment, and could spur a major advance for the OOH advertising industry.
The industry is already resurgent. Innovative firms like JC Decaux are employing digital tools to better connect advertisers with target audiences. Adding flow maps to that analysis could lead to more precision in terms of where to place advertising and what rates to charge for each location.
For advertisers, retailers, and real estate planners, it’s a modern twist on a medium that first proved its value two centuries ago.
This article was originally published in the global edition of WhereNext.
The Unseen: After a Disaster, Imagery Gives Insurance Companies a Clear Picture
New technology on the ground and in the sky is helping insurers see what they haven’t seen before and assist clients more quickly.
Some of the most famous planes in the weather world are hurricane hunters, piloted by steely nerved aviators who fly into storms to measure what is imperceptible to people on the ground. Since the first storm-chasing pilot plunged into a hurricane on a dare in 1943, the practice has become a standard tool of weather forecasting.
Today, a new breed of flier—with a little less derring-do but an equally important mission—is helping people see what was previously unseen.
Article Snapshot:
Eager to help clients recover in the wake of adverse weather, but kept out of disaster zones by ground-level hazards, insurers are taking to the air and converting aerial imagery into location intelligence to quickly make clients whole again.
Struggling for Basic Awareness
Human ingenuity can be a poor match for nature’s strength. When hurricanes, wildfires, or tornadoes strike, the human instinct is to hunker down or flee. In the aftermath, even our most adaptable tools can fail. All-terrain equipment, amphibious vehicles—these often can’t enter disaster zones when obstacles abound or dangerous conditions persist.
That can leave residents, first responders, and government officials struggling to gain a basic awareness of what has happened and what to do next. Such blind spots slow operations at a time when delays can be measured in lives lost.
Eager to overcome those limitations, a consortium of insurance companies is working to change the nature of recovery. They formed the National Insurance Crime Bureau’s Geospatial Intelligence Center (GIC) on the premise that aircraft can help rapidly identify damage from large-scale weather events that would otherwise take a long time to discover—essentially uncovering the unseen.
If early results are any indication, this new brand of visibility could soon be as routine as a pilot cutting through the eye of a hurricane.
Operational Visibility from the Sky
The work of the GIC is possible through a fleet of small airplanes equipped with high-resolution cameras, as well as on-demand computing power and location intelligence technology.
The center’s mission is to spot changes on the ground. It sets a baseline by shooting ultra-high-definition aerial photography across the country on an annual schedule. Then, when major weather events hit, the pilots take to the air as soon as conditions allow and begin shooting images of the damage.
“One of the powerful uses of this tool is that with the aerial imagery, we can increase our engagement with our customers before our claim professionals have physically deployed into an impacted area,” says Don Florek, vice president of catastrophe management at Travellers, the sixth-largest insurance company in the United States.
Imagery alone doesn’t give Travellers and its peers a head start on customer care; it yields data but not necessarily context. To see what people on the ground can’t see, Travellers imports the aerial photographs into a geographic information system (GIS) and melds the raw imagery with road networks, clients’ addresses, and weather data.
Since most weather events cover many square miles, company analysts created an artificial intelligence model that speeds up the identification process. Trained on thousands of images and powered by machine learning, the program quickly flags locations where clients have been affected.
Florek describes the location intelligence that Travellers sees with the resulting GIS-based smart maps. “We aggregate millions of data points from weather services to create event overlays, allowing us to visualize the data. The sophisticated use of layered geospatial insights enhances our overall operational intelligence,” he explains.
That data could include wind speeds, rainfall—even the diameter of hail that fell in a particular location. Operational awareness of this kind gives Travellers and its clients two advantages: vision and speed.

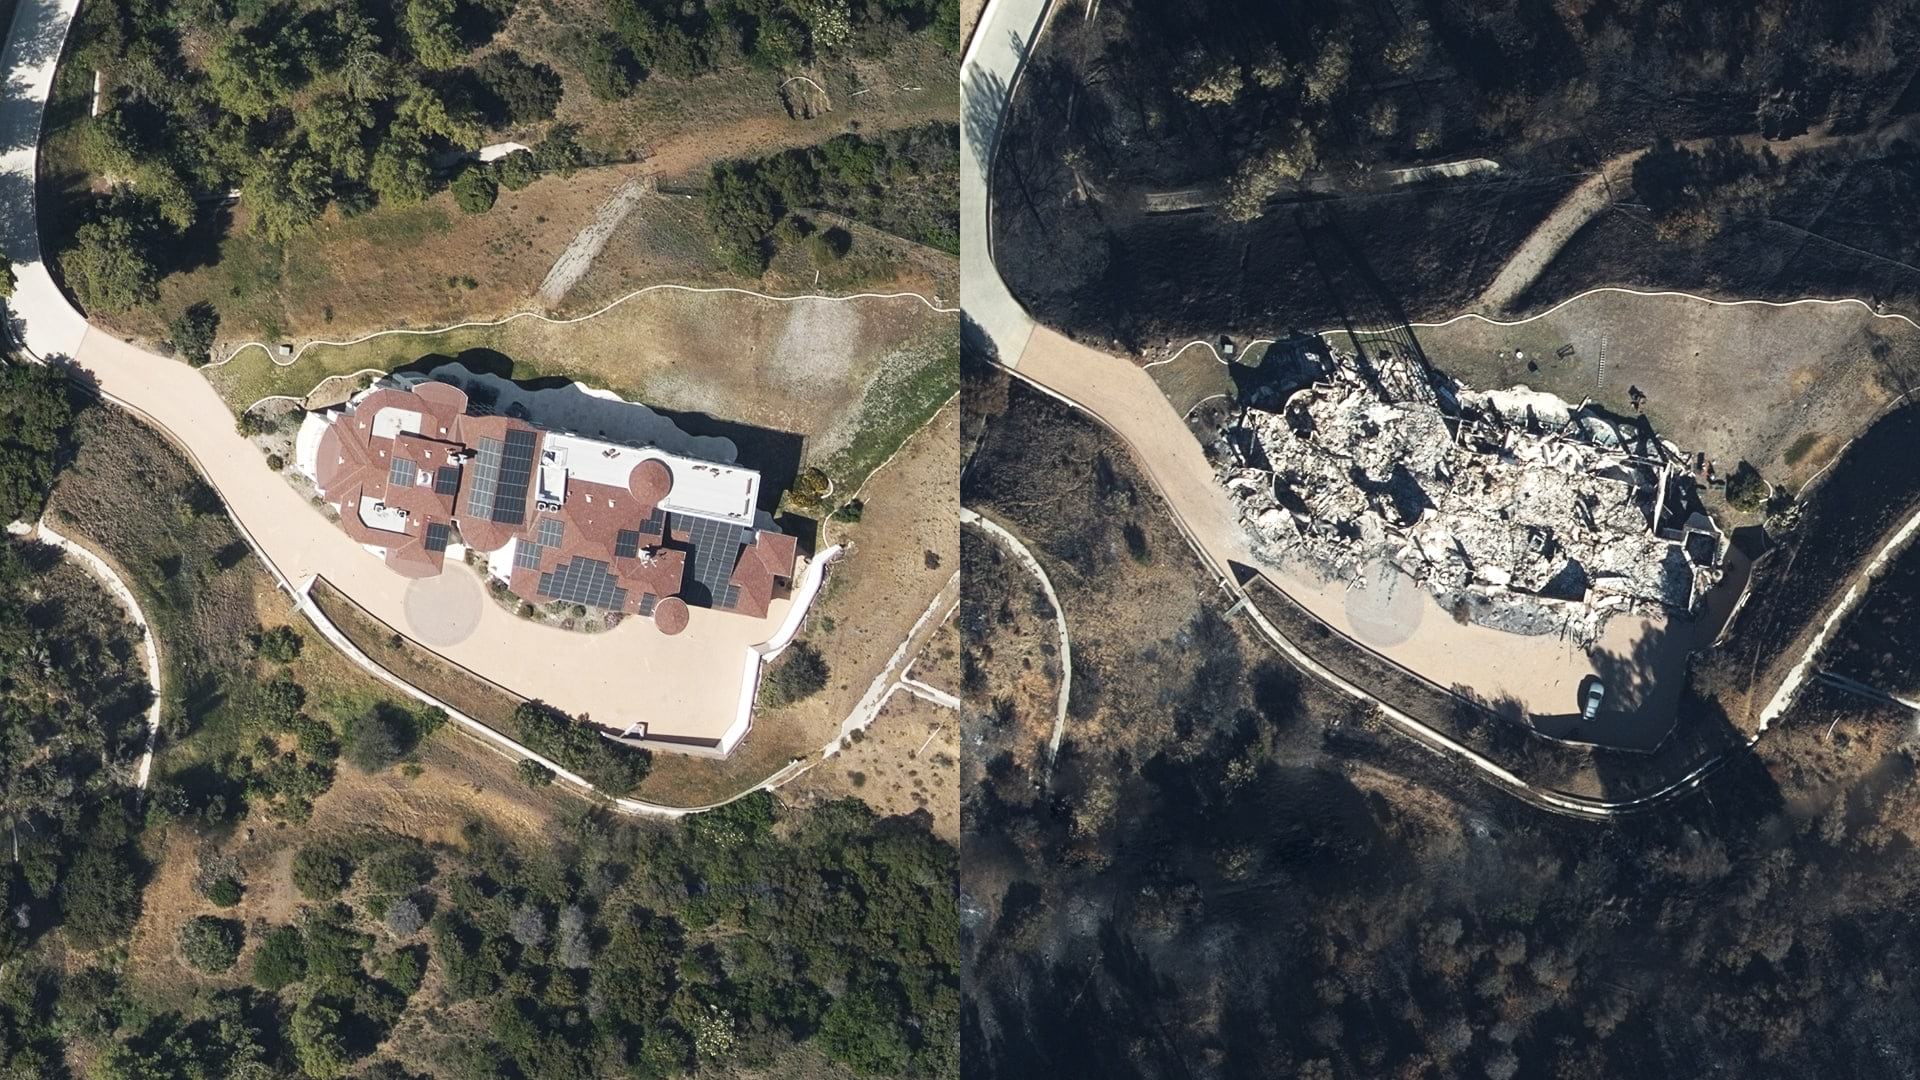
With the California wildfires as well as other large-scale events like the hurricanes, aerial imagery became a really critical component of our event response.
Don Florek, Travellers
Reaching Out without Prompt
Some Travellers clients initiate claims soon after an adverse event. Others can’t access their neighbourhoods to see what has happened to their homes. In those cases, Travellers can now use its view of the unseen to initiate contact. This happened in the days after the Camp Fire decimated Paradise, California, in 2018.
“We used the aerial imagery and the geospatial applications to assess property damage throughout the evacuated areas, allowing us to identify homes that had been completely destroyed or even partially damaged,” Florek says. The imagery “allowed us the information to begin reaching out to those customers to identify if they were safe [and] to begin the claim process and begin to understand how best we could help them. That’s completely different than how we would’ve approached something several years ago, without having that same level of insight,” he notes.
First responders and local officials now enjoy the same increased visibility, since GIC provides imagery to them as well.
“That bird’s-eye view of the affected area gives first responders important clues to where they should deploy resources at a time when speed is critical,” says Ryan Bank, managing director of the GIC.
Focusing on Customer Satisfaction
For now at least, the twin-engine pilots and their high-resolution cameras haven’t replaced traditional methods of disaster assessment; insurance adjusters still need to inspect damage in person to complete most appraisals. But the imagery, combined with location intelligence and AI, bolsters situational awareness immediately after tumultuous events, when speed of recovery is critical.
It is also proving valuable in other areas of the insurance life cycle. Risk analysts, for instance, have begun using location intelligence from imagery to fine-tune models of risk. With GIS-based analysis, they can more accurately predict threats to specific locations. Fraud examiners are interested in aerial imagery, too, since it creates an additional check on homeowners who falsely claim that a weather event damaged their property.
In claims handling, the ability to see what was previously unseen has already helped Travellers increase its customer responsiveness. For example, in 2018, Travellers says it resolved 94 percent of claims within 30 days—during a year crowded with major disasters. That type of efficiency is key in the insurance industry, where the second most common client complaint is that their payments were delayed.
For Florek and the team at Travellers, having eyes in the sky and location intelligence on the ground has helped turn understanding into action.
“The layered geospatial insights really provide us with a whole different level of operational insight to understand the event, the impact for our customers, and how best to deploy the right people to the right place as quickly as possible,” Florek says.
This article was originally published in the global edition of WhereNext.
What 2019’s Smartest Cities Have in Common
Go behind the names on the 2019 smartest cities list to see what makes these cities so advanced.
London and New York are the world’s smartest cities, according to the 2019 Cities in Motion Index (CIMI), issued by the IESE Business School. The index ranks 174 cities across nine dimensions: human capital, social cohesion, the economy, governance, the environment, mobility and transportation, urban planning, international outreach, and technology.
Many of the smartest cities on the list use location intelligence to help civic leaders and executives create data-driven performance, operational efficiency, and situational awareness and plan long-term improvements that benefit all residents.
Article Snapshot:
Location Intelligence: Building Smart
As IDC analyst Alison Brooks put it in a recent podcast, location is the grammar of smart cities. In the face of complex challenges such as homelessness, mobility, pollution, and aging populations, leaders of the world’s smartest, most sustainable cities are combining location-based technologies with human ingenuity to improve living and working conditions.
Six of the CIMI dimensions for measuring smart cities benefit from the introduction of location intelligence:
Environment—As they do in San Francisco (#21 on the CIMI), smart city planners can model potential buildings and predict short- and long-term impacts on the environment. Conservationists can choose where best to incorporate green spaces or plan conservation projects, as well as analyse air quality and spot its causes in different areas of the city.
Governance—City agencies often use location technology called a geographic information system (GIS) to share data across silos and operate more efficiently. Los Angeles (ranked #16 on the CIMI) created a dedicated information hub to centralize the city’s open data and communicate with citizens about smart city initiatives.
“When LA began to organize all of its open data with the [geo]spatial tag, it allowed great insight across the department,” said Harvard professor and former Indianapolis mayor Stephen Goldsmith in a recent podcast. “So now the departments can see each other’s data located in a sense of place.”
Industry-leading businesses have taken a similar approach to data, believing that information reaches its full potential when it is democratized.
Human Capital—Strategists and business leaders can analyse the demographics of a city’s population and use that insight to plan improvements that attract specific talent. Some cities that fly under the radar of global business schools like IESE have done pioneering work in this area, including Bentonville, Arkansas, home of Walmart’s global headquarters.
Mobility and Transportation—Forward-leaning officials can better manage transportation systems and plan repairs with the help of location intelligence. For example, Metropolitan Transit Authority executives in New York City (#2 on the CIMI) use GIS to manage $1 trillion in assets and plan long-term improvements for the country’s busiest subway. Meanwhile, Paris (#4) uses IoT-based applications to optimize the flow of traffic in the city, and Singapore’s autonomous taxis rely on virtual maps as a source of truth.
London (#1 on the CIMI) built autonomous vehicles to enhance mobility at busy Heathrow Airport and combined GIS with building information modelling (BIM) technology to undertake Crossrail, Europe’s largest construction project. Crossrail executives needed to know the precise locations of underground infrastructure to safely weave new tunnels through the built environment.
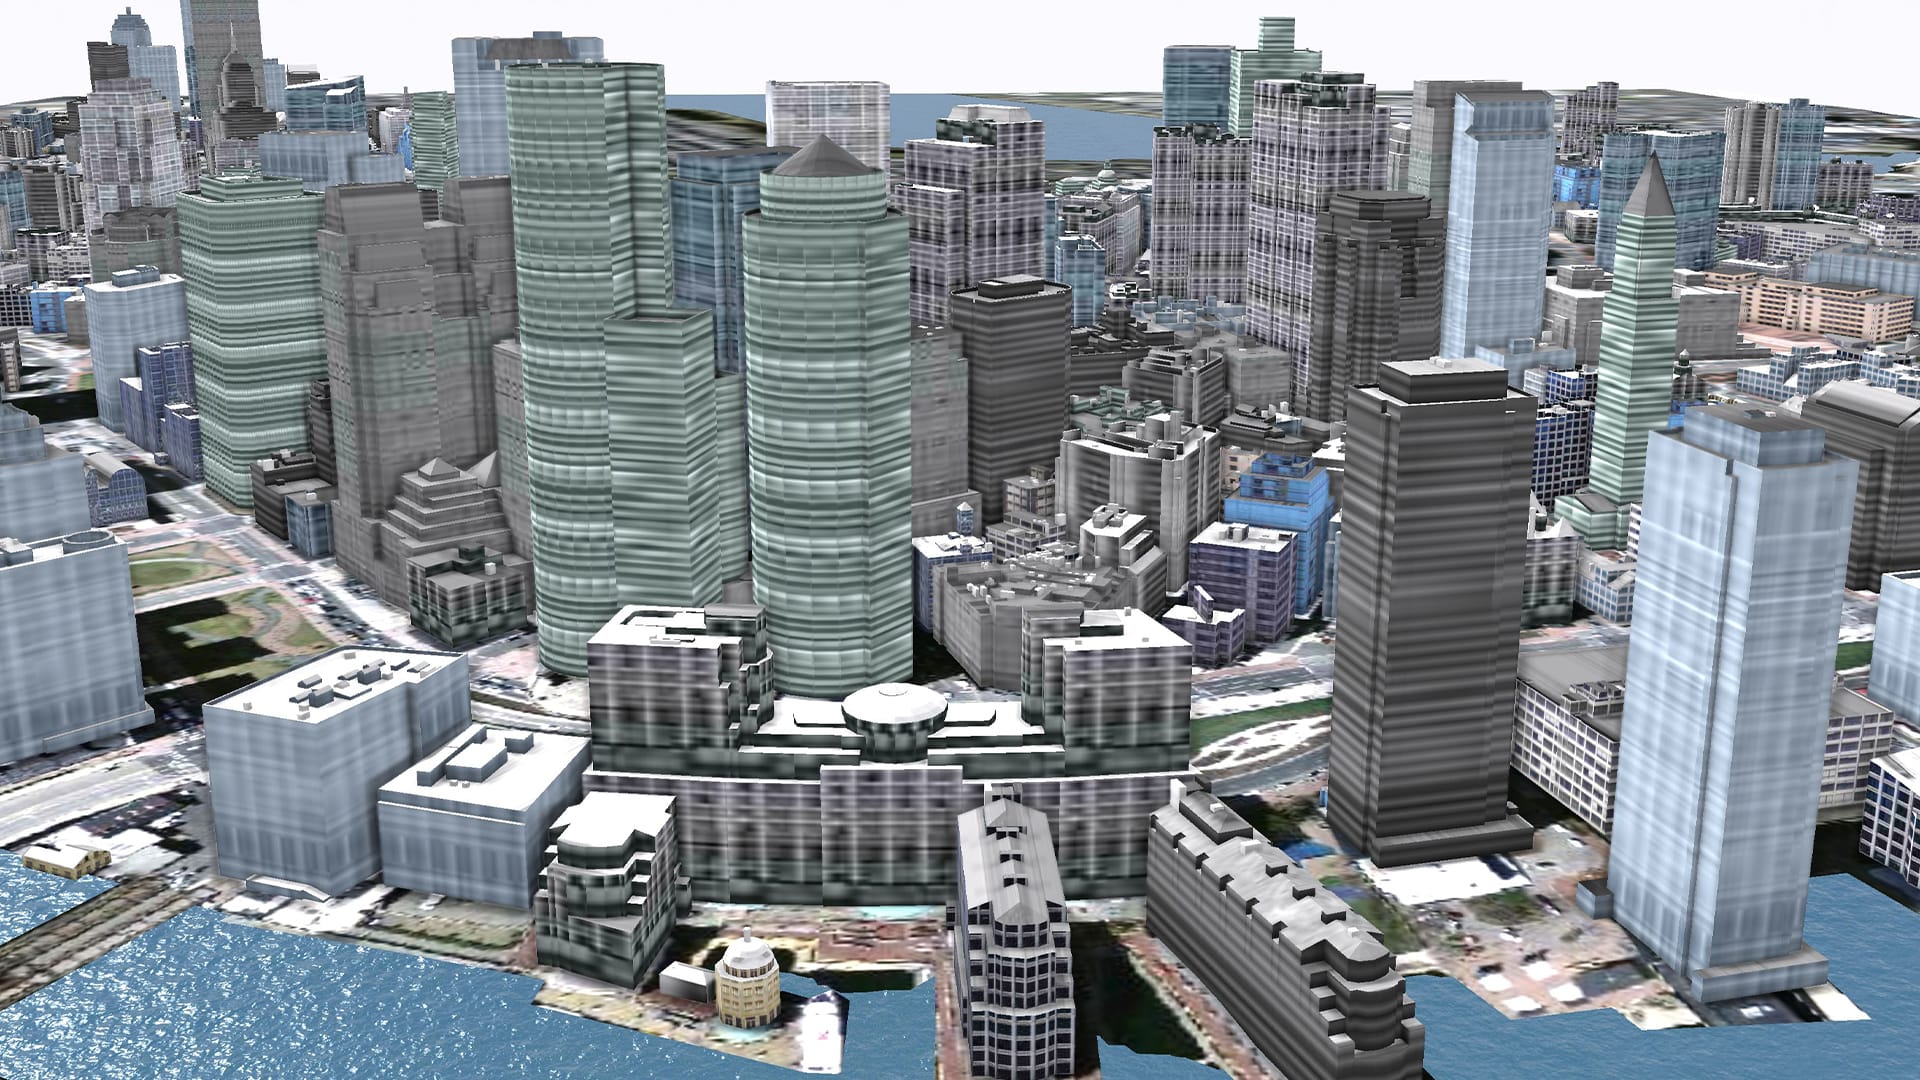
Urban Planning—City leaders; businesses; and architecture, engineering, and construction (AEC) firms can see how a structure will look before they decide to build it, measuring views from a virtual apartment window or the shadow of a skyscraper on a local park.
Cities such as Boston (#25 on the CIMI) are constructing 3D models of their physical infrastructure and using location data as a connective thread to experiment with virtual plans.
Technology—The CIMI calls out technology as its own dimension, but as the above examples show, technology is the backbone of many smart city initiatives. According to IESE, a smart city can be measured in part by the access its citizens have to critical communications technologies, including computers, mobile devices, and the Internet. One telecom company in Italy is working to make that access more equitable, while its peers in the US and elsewhere are using artificial intelligence to roll out the 5G networks that will power tomorrow’s smart cities.
The Inner Workings of Location Intelligence
Location data helps cities get smart and businesses make better decisions. See what that looks like in practice in this e-book on location intelligence.
The Business Value of Smart Cities
As cities work to become smarter and more sustainable, savvy business leaders are getting involved. Authors of the CIMI report note that the private sector is uniquely experienced and skilled in project management and technology applications and has much to contribute to smart initiatives.
Business executives can benefit from smart city projects by building better relationships with city leaders, understanding local markets more deeply, and profiting from the greater international visibility that attracts talent to their cities.
Conversely, there’s much at stake for business leaders if their host cities don’t get smarter and stay competitive. IDC’s Brooks warns of the knock-on effects to businesses in cities that aren’t improving:
The cities that don’t digitally transform to meet up with those citizen expectations and business expectations, they in fact lag in terms of economic viability across the board, so they don’t attract talent, they don’t attract businesses, and so then there’s this process of degradation and stagnation that occurs. We see the direct linkage between digitally transformed organizations, citizen satisfaction, and economic growth and viability, which altogether makes it a collective no-brainer.
Advancing Technology, Advancing Cities
Goldsmith’s perspective on smart cities is coloured by the drastic technology changes experienced in the past decade.
“In the last five years, the technology breakthroughs have been just breathtaking. And the problems that now can be solved with technology were unimaginable, I mean, 10 years ago, even 5 years ago.”
It’s a good reminder that becoming a smart city isn’t really about getting a top score in a report, but about solving urban problems and making life better for every citizen and business. As many civic leaders now realize, when location intelligence meets innovation, cities and citizens get smarter.
Find your city and compare it with others in this interactive map from IESE.
This article was originally published in the global edition of WhereNext.

Unseen: How Businesses Protect the Public
With lives at stake, companies are using location analysis to prevent injuries and deaths.
Wherever businesses come in contact with people, they are working hard to minimize hazards and ensure safety.
Spurred on by consumers who demand safe practices from the companies they support—and mindful of the consequences of negligence—pioneering organizations are pushing beyond what is necessary as they find new ways to safeguard the public.
Here we reveal how companies are using technology to see where the public is vulnerable, understand why, and develop strategies to lessen the chance of harm.
Quietly, their work is saving lives.
Article Snapshot: Businesses are increasingly focused on how to ensure public safety. Innovative organizations have found that location intelligence bolsters these efforts by revealing areas where safety measures will have the biggest impact.
Seeing Clear to the Danger
For one electric utility in Australia, 2015 and 2016 were average—and dangerous—years. During that time, residents made 1,400 accidental contacts with the company’s assets: overhead power lines, underground cables, utility poles, and other structures.
Ostensibly, the offenders were civilians and working professionals driving cars, tree-trimmers, grain harvesters, and excavators. But the real culprit was lack of visibility. No one involved in the incidents set out to contact high-voltage equipment. They simply didn’t know where hazards were located before they broke ground on a housing project or maneuvered a tractor around a worksite.
The minor incidents resulted in damage to property. The high-impact events cost lives.
Concerned, managers and executives responded by investing heavily in the utility’s hazard prevention and education efforts.
To help prioritize their outreach to customers and the community, they set out to identify the types of incidents that occurred most often. For that, they needed visibility into the location of all incidents, the contributing circumstances, and the most grievous outcomes. The team enlisted a technology commonly used to map utility networks—a geographic information system (GIS).
GIS created location intelligence by plotting the 1,400 incidents on a map of the company’s service territory—all 300,000-plus square miles of it. For each incident, executives could see the vehicle that made contact with electrical equipment and the type of equipment involved, as well as when it occurred and whether injuries or death resulted. Among other revelations, the analysis showed a high concentration of accidents on farms during months that coincided with harvest seasons.
More Effective Education and Prevention
Knowing that farm vehicles—balers, forklifts, backhoes—frequently hit overhead wires revealed only part of the story. The utility company needed to peer deeper into the problem to see why. Executives turned to artificial intelligence.
On public roads, utility companies can pinpoint where low-hanging wires might cross paths with cars or trucks, and install warning equipment to minimize accidental strikes. But the roads on farms—even large ranches with miles of improvised roads—aren’t mapped in public databases. The utility team couldn’t see the conditions that created the company’s greatest hazard.
They turned to a GIS-based machine learning model to create the visibility they needed. The model paired coordinates of each incident with satellite imagery of the area, and began to spot unpaved farm roads that crossed beneath power lines. With that insight, the team could see what it hadn’t previously seen.
Armed with location intelligence, company representatives fanned out to talk to farmers about safety and install preventive equipment on power lines.
The utility’s GIS also helped staff schedule outreach for maximum effect. The system identified not just the location of farms, but what type of crops they grew. Using that data, the company timed its outreach to precede the various planting and harvesting seasons, when farmers and farm equipment would be most active.
The utility even gave farmers a GIS-based app that revealed electric infrastructure and hazards on their land. Similarly, crop-dusting pilots could access an app to visualize power lines at each farm where they applied treatments.
Through these efforts, the utility helped farmers see—and avoid—dangers that had previously been unseen.
Saving Lives on the Brink
Around the world, suicide attempts are a difficult fact of life on railways.
Germany reports an average of 800 suicides by train every year. In Japan, 6 percent of suicides happen on the rails. In the US, nearly 1,700 people ended their lives on train tracks in the six years leading up to December 2017.
In each instance, one life touches many others. The train conductor becomes an unwitting accessory to death. The victim’s family loses a loved one. Railroad police and first responders encounter a scene that can stay with them for years.
Amid the magnitude of the human tragedy, there are also operational consequences. Hundreds of passengers will be stranded on their journeys to work, weddings, or job interviews. Some may be injured due to the abrupt engagement of the train’s brakes.
Officials at Amtrak, the only high-speed intercity passenger railroad in the US, did not accept train suicides as inevitable. Instead, they have chosen to use data to change the story.
Early signs show it’s working.
Convincing the Skeptics
Barbara Petito didn’t think it would. The Amtrak Police Department’s lead communications specialist thought there wasn’t much that could stop someone bent on ending their life.
“I was not on board in the beginning because I just didn’t know that we could measure any value. And I was not sure that, honestly, this was going to be a method to eliminate the incidents of suicide on the railroad,” Petito told WhereNext.
But Amtrak chief of police Neil Trugman was convinced the company needed to take action, and a colleague named Michelle Jennings had already begun using data and location intelligence to assess the situation.
When Petito got involved, she found Jennings hard at work, using GIS technology to spot unseen patterns in the data.
Grim Trends Emerge
With approximately 87,000 daily riders, Amtrak runs the equivalent of a midsize city—if that city were spread across 46 states, hundreds of stations, and 22,000 miles of track. The same crimes that happen in a city happen throughout a rail network: vandalism, disorderly conduct, theft.
Amtrak’s police department had been using GIS for years to understand and mitigate those incidents. Jennings and the team routinely created hot-spot maps of crime and steered Amtrak officers toward places where preventive policing might yield the biggest impact.
Now she was using the same technology to understand where suicides occurred. Through GIS, Jennings identified the exact location of every pedestrian incident and—by collating additional information such as coroners’ reports and video feeds—determined whether the event constituted a suicide.
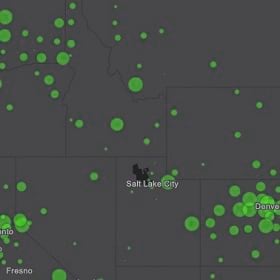
She plotted all the events on a nationwide map, and patterns emerged. Clearly there were clusters—places where two or more people had committed suicide. The highest concentrations were in Florida, Illinois, and parts of California—the Bay Area and southern portions of the state.
Officials wondered why.
As Jennings deepened the GIS analysis, she saw clues: Some areas lacked fencing to keep pedestrians out. Other locations were close to homeless encampments near the tracks. In Carlsbad, California, a mental health facility sat near the site of several recent deaths.
By 2017, the investigation had revealed 150 sites—100 along tracks, another 50 at stations—where multiple suicides had taken place.
Using Data to Change the Course of a Life
Petito, her skepticism dimmed slightly by the insight she saw on the map, set to work. Her opportunities for action were complicated by the fact that Amtrak owns fewer than 1,000 miles of the 22,000 miles of track it travels; the rest it accesses through agreements with host railways. But through its own actions and the help of its rail partners, Amtrak worked to install access barriers where it could, and directed its officers to patrol other high-risk areas in hopes of deterring suicide attempts.
Still, many rail lines run on street level and cross pedestrian areas where physical barriers aren’t possible. So Petito and team also invoked a more direct tool. With guidance from Jennings, they installed suicide prevention messages in problem areas. About the size of a stop sign and visible even at night, the signs include the phone number of the National Suicide Prevention Lifeline (800-273-8255).
Petito knew just where to place them, thanks to Jennings’ analysis.

“If you have 22,000 miles of railroad and you’re just putting these out there willy-nilly, I’m not so sure you would have any kind of success,” Petito explains. “We’ve been able to place signs in the exact areas where these strikes have occurred.”
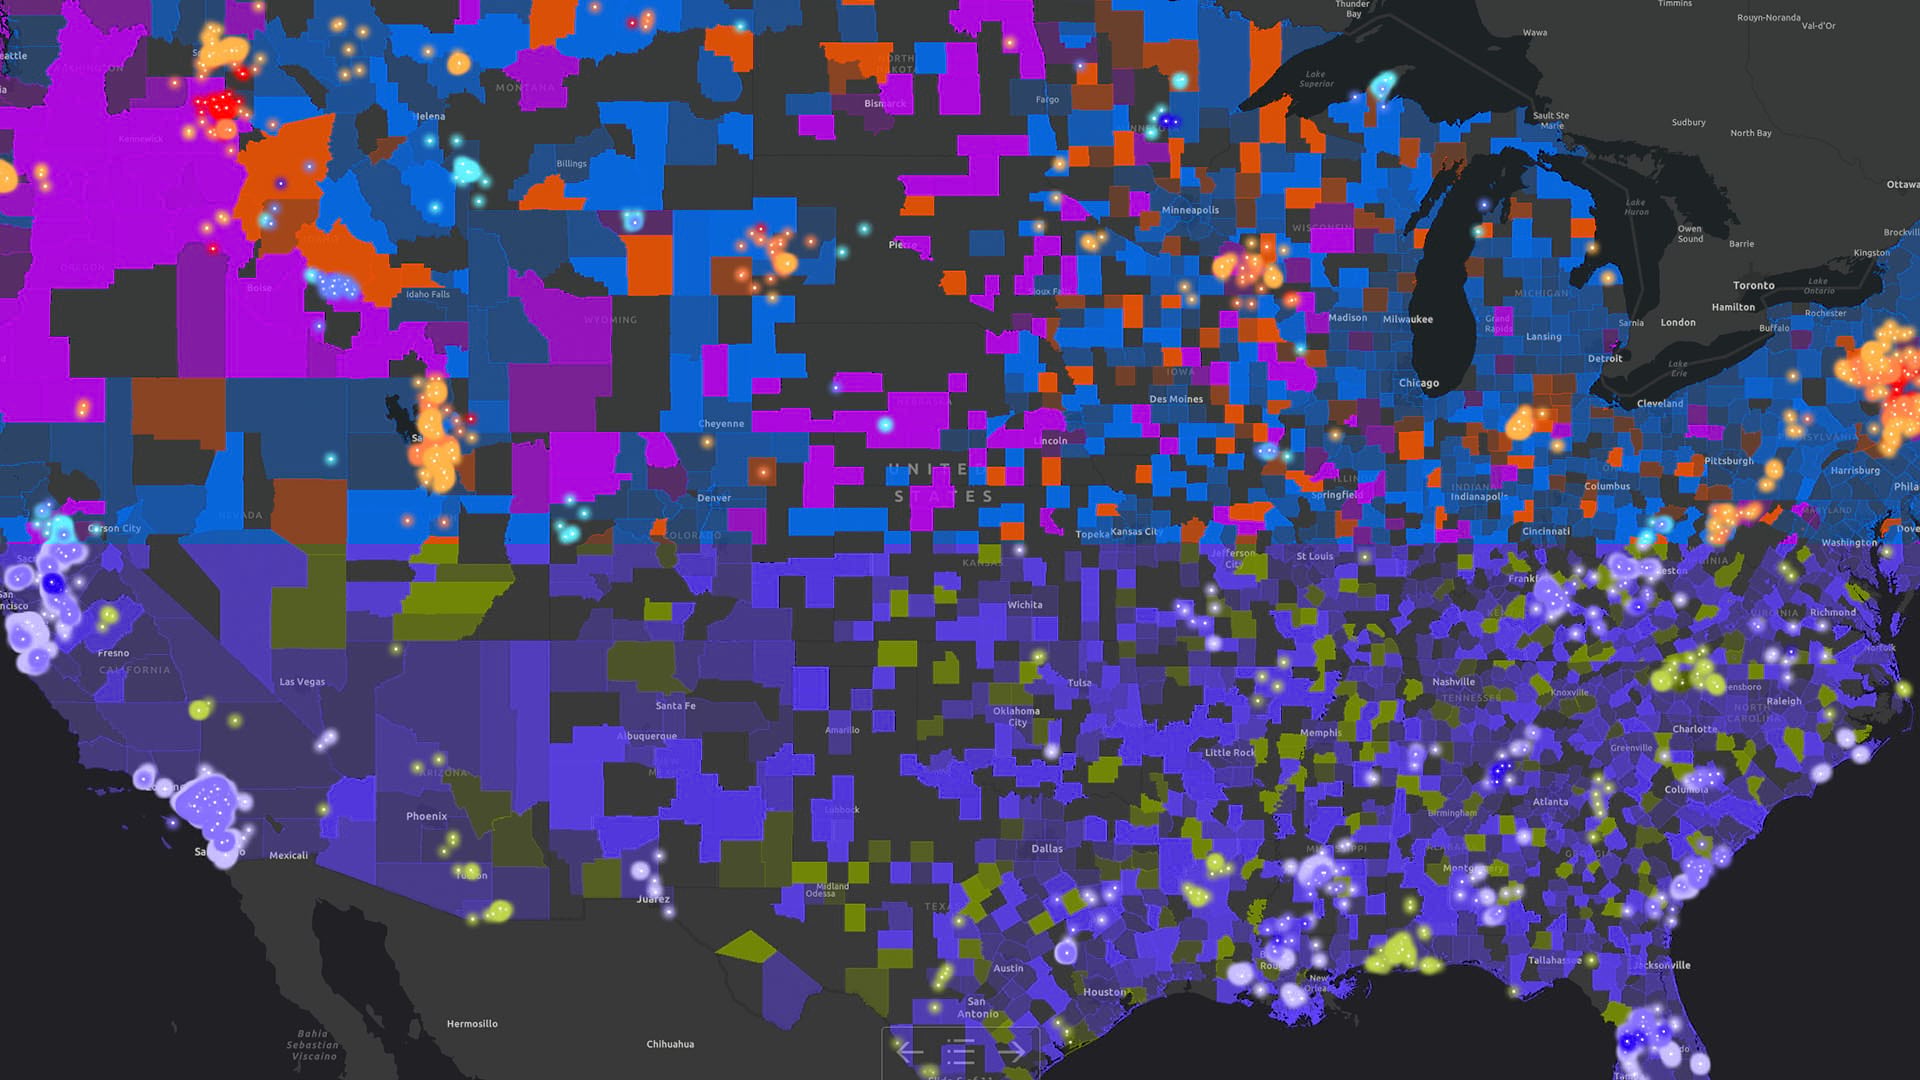
To the relief of Petito, Jennings, and all Amtrak professionals, the increase in the number of signs (222 at last count) coincided with a decrease in the number of suicides on the company’s tracks. From a total of 84 in 2017, the number dropped to 56 in 2018. In specific regions like California, the total went from 21 suicides in the year before the signs were installed to 12 the year after, a 43 percent drop (see image above).
Petito says she’s been heartened by the results, although she and Jennings caution that there’s no definitive proof the program alone is responsible. Still, “there’s a certain percentage of people who are attempting to commit suicide, that see a sign like this, offering help, offering an alternative, [and] they will respond to it,” Petito says. “So that’s what I can say may be happening here.”

In my mind, this is a success. I don't know if scientifically it could be documented as such. But if someone's responding to this, thank God we've done it, and I applaud the host railroads that have agreed to work with us on this program.
Barbara Petito, Amtrak
Seeing as a Company Grows
Creating visibility across 22,000 miles of track, 300,000 square miles of utility infrastructure, or a sprawling network of stores and offices can be a daunting challenge.
For Amtrak, the utility company, and many other organizations, GIS technology is producing location intelligence that helps decision-makers see problems clearly and understand how to react.
At Amtrak, it turned Petito into a believer.
“There is no question that without that technology, I wouldn’t even begin to try to claim any kind of success for this program.”
This article was originally published in the global edition of WhereNext.
The Ethics of Supply Chain Transparency
For companies seeking to demonstrate their commitment to sustainability, location intelligence and supply chain transparency are essential.
Supply chain transparency has become a form of currency for both businesses and consumers. Detailed knowledge about how a product moves from origin to destination is now more than just a tool to monitor product safety and manage disruptions like storms or political upheaval. Increasingly, it also answers calls from younger consumers for sustainably and ethically sourced products.
To deliver this new level of supply chain visibility, responsive brands are turning to location intelligence.
Upping the Ante on Transparency
Multinational retailer H&M recently raised the profile of this trend. The Fortune 500 purveyor of fast fashion announced it would begin an ambitious program of garment transparency, allowing consumers in 47 online markets to find information on each item of clothing. Details include the name and location of the factory where it was made, the size of its labour force, and the materials used to craft the item. Brick-and-mortar customers can access the same information by scanning a price tag using the company’s app.
Accurately linking such data to far-flung suppliers has typically been a heavy lift for companies—one of the reasons business leaders have come to rely on a technology called GIS (a geographic information system), which delivers location intelligence by illustrating supply chain networks on a map.
H&M professes the first global fashion retailer to institute product transparency on this scale. The initiative falls in line with other moves the company is making towards sustainability, including its goal to use only sustainably sourced or recycled materials by 2030.
These measures have netted H&M favourable coverage, landing it in the fourth spot on Fashion Revolution’s annual Fashion Transparency Index last year. The Fashion Law, a blog that covers business and legal issues in the fashion industry, named the company even more transparent than Everlane, the direct-to-consumer clothing brand popular with Millennials that has made transparency a pillar of its business model.
Map-Based Visibility
Companies looking to demonstrate a commitment to sustainability and ethical partners often find location intelligence invaluable in making supply chain practices safe, secure, and transparent. This transformation has already begun in the usually opaque diamond business, where DeBeers, IBM, and Signet Jewelers have partnered to use blockchain-based technology to identify the mines their merchants patronize. By pegging each transaction to an exact location—information that is then securely shared among parties via blockchain—GIS can enable such efforts to reach new levels of reliability and specificity.
In today’s global market, the challenge of such an undertaking is formidable. In a 2017 survey by logistics provider Geodis, just 6 percent of respondents reported having full visibility over their supply chains, even as that issue has become their third-highest priority. Many manufacturers simply don’t know what is happening in the networks they rely on to cultivate and transport their goods and supplies. That failure of transparency can lead to safety issues, cultural missteps, and PR crises.
Companies that do manage to create visibility often do so by adopting a “single pane of glass” perspective on supply chain operations and data, one made possible by GIS. The technology delivers location intelligence by collating multiple layers of real-time or historical information onto a smart map, giving operators situational awareness and the ability to respond quickly.
“Essentially, on one screen, they see a holistic view of their organization—its facilities, moving assets, personnel, and vendors and partners in the supply chain,” said Esri’s Steve Marshburn in an interview about corporate security. This capability enables businesses to honour their commitments to sustainability and avoid reputational damage.
Customers with higher expectations born of an information-rich climate are putting pressure on companies to operate supply chains that support the environment and fair labour practices.
A New, Sustainability-Minded Consumer
Consumers, especially younger generations like Millennials, are demonstrating their commitment to sustainability through their wallets. A recent Nielsen report found that products with legitimate claims to sustainable practices showed better growth than competitors—a distinction that can lead to better retail shelf placement. More than other consumers, online buyers want to know the provenance of their purchases and will reward transparency with greater brand loyalty.
“Today’s global consumer—empowered by information and high on expectations—has fuelled a right-now economy that forces businesses and supply chains to accelerate both their decision-making and their quality delivery of products and services,” says Cindy Elliott, head of Esri’s commercial industry marketing team.
As this trend intensifies, more companies will follow industry leaders in enlisting location intelligence to create greater supply chain transparency.
This article was originally published in the global edition of WhereNext.

How Companies Are Planning for a Wave of Senior Living
Businesses use location tech to anticipate new markets as aging populations alter economies, lifestyles, and housing needs around the world.
A seismic population shift portends immense economic change across the globe, and the most forward-thinking business executives are searching for ways to position their companies ahead of these changes.
By 2030, one in five people in the U.S., 20 percent of the nation, will be over age 65. Globally, the trend is similar.
The so-called silver wave will influence many parts of the economy. Retailers and service providers will seek out seniors residing in age-defined communities that create clusters of older consumers in one location. Housing providers will be testing the market to gauge demand for independent living, assisted living, and skilled nursing care.
Many other options also are being developed for those who want to age in place at their current residence, and those who want something in-between, such as smaller apartments with shared living, kitchen, or recreation facilities.
As this complex market grows, some businesses already have turned to geographic information systems (GIS) to predict where growth of older populations will be concentrated and which economic choices and personal interests those residents will pursue. With sophisticated location analysis, GIS software can forecast patterns of migration, consumer behaviour, and housing preferences, including who is likely to move and where.
Article Snapshot:
Developers and consultants hoping to cater to seniors with a high level of home equity are using predictive tools to anticipate where they will live and what kind of housing they’ll expect.
Choices Grow for Senior Living Options
The larger the over-60 segment grows, the more varied its interests and needs will be—and the more informed a business must be to win those customers.
While many seniors may choose to live near their adult children or stay in the area where they raised families, many others are willing to relocate to find the community and climate they want. Knight Frank, a global real estate firm headquartered in London, estimates that although just a third of seniors consider moving into dedicated senior housing, that population will be so large that investors have shown interest in building residential units to suit older consumers around the world.
According to a United Nations report, the number of people age 60 or older is expected to more than double to 2.1 billion in 2050. If just a third of those seniors seek to move to a new home, that’s still a market of 700 million potential customers.
To identify the right mix of age, income, and personal interests for the investors, developers, and business executives it consults, Knight Frank relies on GIS software that can analyse markets in the context of location. The firm can locate concentrations of seniors bearing a trait that distinguishes them from previous generations: economic clout at retirement age and beyond.
Many boomers will turn 65 while continuing to earn a good salary; many others already will have started drawing from substantial retirement plans. Naturally, some segments of seniors may face difficult circumstances—and some have not saved enough for retirement. But the boomer generation as a whole remains an economic dynamo. Already the wealthiest generation, they are expected to control 50.2 percent of net household wealth in 2020.
Investor Interest Rises with the Silver Wave
Where once older people often had limited housing options, now consumer-savvy and financially secure seniors can demand flexible, customizable choices.
More and more, seniors will look for living arrangements that suit their individual needs. That could mean a wellness community that emphasises healthy living and recreation, a housing development with multilingual staff, or top-of-the-line housing for those seeking luxury in their golden years.
In recognition of varied tastes, some edge-seeking businesses and investors are investigating ways to predict where and what kind of senior housing developments will be needed.
Knight Frank uses GIS-powered location intelligence to map out possible business opportunities. “Spatial analysis finds us the right balance of market and demographic conditions, uncovering opportunities particularly suited to individual clients,” says Ian McGuinness, head of the geospatial team and a partner at Knight Frank.
Investors are interested in a range of senior housing projects, including higher-end developments that are essentially subdivisions—or even small cities for seniors. Places such as The Villages, based in Sumter County, Florida, have been highly successful at attracting residents. In fact, a 2018 U.S. Census Bureau report found that The Villages ranked first among all U.S. metropolitan areas in percent population growth. The senior-living development grew from 93,420 residents in 2010 to 128,754 in 2018—an increase of nearly 38 percent.
Once a developer identifies geographic areas where the senior population is expected to grow, the next step is often to use GIS to locate potential properties and determine whether the sites should become communities, apartments, shared dormitory-like accommodations, or even mixed-age developments near a college campus.
GIS-based analysis mixes demographic and commercial market data with predictive algorithms to guide developers to where seniors will be.
Policy Guides Investment
As business leaders and investors explore the strengthening senior living market, some governments are creating guidelines to accommodate this demographic shift, in the same way some areas have imposed rules for including affordable housing in development plans.
In Europe, where 25 percent of the population has already reached 60, the European Union has announced initiatives to prepare for further growth. And in London, governmental authorities have begun developing benchmarks for the amount and type of senior housing that should exist in the city and surrounding boroughs. The New London Plan aims to ensure that a certain percentage of each residential project includes housing for seniors, based on the characteristics and needs of the locale.
That official focus on future needs has helped stimulate interest in senior housing from both operators and investors around the world, including in China and the Middle East, in addition to Great Britain and the U.S. “Finally, it seems that at least a few people have woken up to what’s going on,” says Tom Scaife, who heads up the senior living team at Knight Frank. “We know from colleagues across our network that there’s an impending need in some other countries as well that’s only getting more accentuated.”
To explain the phenomenon to potential investors, builders, and retiree services companies, Scaife and his team plot the results of location analysis on intuitive smart maps.
They use GIS software to analyse and map the relationships among hundreds of pertinent data points such as expected growth of older populations in a region, country, city, or neighbourhood. These smart maps can collate predictions with available space to model development, surrounding retail and recreational opportunities, price points for various groups of retirees, and cost of construction and staffing.
New Precision in Their Sights
Companies are discovering that the data created by digital transformation helps them see where and how business conditions will change. Learn more about their experience with location intelligence.
Finding a Place to Call Home
The location intelligence produced by GIS also guides seniors on decisions about their own future.
“We can analyse cost of care within these housing situations versus cost of care delivered into your own home,” Scaife says. “If you add in other costs like running your home and upkeep, then you can start to build a picture, make an analysis and compare the cost/benefits of relocating at that point in life.”
GIS-based analysis also can include the availability of wellness programs, public transportation, and demographic traits of a neighbourhood such as sex, race, ethnicity, family size, and the lifestyles that seniors enjoy. Results forecast where and how significantly the silver wave will impact not just housing, but other sectors as well.
With predictive capabilities, companies across the business world are using location intelligence to see what competitors have missed, and gain an edge:
- Retail companies are using powerful AI to anticipate where new stores will boost their online sales.
- Oil and gas companies are analysing weather forecasts to understand how to shift resources for maximum efficiency and return.
- An internet service provider is capturing demand signals in GIS and using them to anticipate growth markets.
Tools for New Insight
The European Space Agency recently showed a way to plan for senior housing through location intelligence and a predictive algorithm. Its analytic program looked at census data, economic traits, and land-use patterns to reveal relationships between people and the places they are likely to call home as they age. When applied to a midsized test city, the program predicted the location of older residents with an accuracy of 95 percent.
Given continued advances in cloud computing, ever-more precise data sets, and artificial intelligence, these predictive models will only strengthen—and just in time. Because as seniors in growing numbers assert their consumer muscle, leaders from a wide array of sectors—retail, healthcare, entertainment, government services, and housing—will seek new ways to serve them.
“We’re in a phase where there’s now enough data available for funders to feel more confident about entering the market,” Scaife says. “But at the moment, there’s more capital than opportunity out there.”
However, with an increasing demand for senior housing and powerful research tools to understand how to service it, more businesses may rise on the silver wave.
This article was originally published in the global edition of WhereNext.

NextTech: Seeing Buildings before They’re Born
A combination of 3D technologies gives planners a view of the future that can preempt cost overruns down the road.
Before you break ground, break a few pixels.
That’s the design philosophy blooming among architects, engineers, and construction firms. Projects traditionally began with 2D designs, moved to 3D physical mockups, and then became real-world infrastructure. With that came real-world hassles. But now structures worldwide are being built and contextualized digitally first.
To the delight of project accountants, planners, and those who will occupy the structures themselves, new technology is shaking up the process of translating 2D designs into 3D reality.
The Situation—A High Cost for Poor Planning
The wisdom of the tailor—measure twice, cut once—also applies to architects, engineers, property developers, construction firms, and others in the building trades. In fact, the amount of time dedicated to planning a property or infrastructure project affects how well it meets the customer’s vision, achieves safety standards, and stays within budget and schedule.
In a 2017 report, a UK-based group dedicated to driving errors out of construction found that the industry lost £21 billion—or 21 percent of its annual revenue—to what sports fans might call unforced errors. The culprits: late design changes, ineffective communication, and poor coordination.
Researchers found that project plans often lacked context that could show how a new building would impact the land and structures around it, and how those structures and land would impact the building.
A new pairing of technologies is doing just that—helping planners see relationships between the built environment and planned structures. With that vision, they can plan for contingencies and avoid surprises during construction.
Article Snapshot: Architects, engineers, and construction managers are discovering that a new combination of 3D digital technologies offers a sound defence against project delays and cost overruns.
The NextTech—A Unique, Combined Perspective
Designers and planners have long sought tools to visualize before they build. Some cities, for instance, have created physical scale models that show all the buildings within city limits. But those models don’t reveal things like underground utilities or a building’s interior spaces, and they can’t be updated quickly as conditions change and buildings come and go.
In the greater London area , a joint venture of Skanska, Costain, and STRABAG is designing a high-speed rail line in a unique way. In what is likely a first in the UK architecture, engineering, and construction (AEC) industry, the partners are planning this £2.1 billion rail project with a combination of 3D technologies—BIM (building information modelling) and GIS (geographic information system).
GIS helps stakeholders see the project modelled with interrelationships such as terrain and structures around the rail line, including underground utilities. BIM provides a detailed 3D view of the structure being built. With the combined tools, planners can see a 3D model in context before they break ground—which can prevent rework and cost overruns.
It’s a technique that holds promise for infrastructure projects and residential developments alike. 3D modelling technologies are now the digital sandbox that allows planners to “stand” in a location and see a proposed project from any angle, within the environment it will inhabit. Thus situated, designers and stakeholders can see the internal and external context of buildings during the idea stage.
The 3D modeling tools are beginning to crop up in projects from simple housing developments to massive infrastructure works like the London rail line. The video below shows how BIM and GIS deliver a simplified illustration of a planned residential development in Lofoten, Norway, an archipelago north of the Arctic Circle. The slides were developed by Norwegian architects Boxs Arkitektstudio.
As the video shows, GIS and BIM create a twinned perspective—a view of the inside of the building as well as its environs. That gives planners the small-scale insight needed to design desirable living spaces and present them to stakeholders. It also reveals the birds-eye perspective that helps planners gauge whether the buildings are situated appropriately within the town.
The Upshot—Foresight Yields Savings
When early planning mistakes materialize during later phases of construction, project costs tend to increase significantly. For instance, when the Wisconsin DOT analysed a long-term highway interchange project in Milwaukee to determine the savings it could have achieved had planners used 3D modelling, the estimate came to nearly $10 million.
In contrast, mistakes in the digital world are free—or nearly so. Recognizing that, global destinations such as London, Singapore, and Boston are going 3D, investing in digital replicas of their cities to speed up project assessments, streamline the permitting process, ensure citizens’ quality of life, and enforce regulations.
Through the marriage of BIM and GIS, today’s architects, engineers, and construction managers are virtually iterating and collaborating on 3D digital models, seeing projects with a level foresight they have not previously enjoyed.
With that vision, they can quickly see what is right—and what could go wrong—with any project.
This article was originally published in the global edition of WhereNext.